
The 16:00 New York fade: inside a seven-year EURAUD night scalper
A public account has grown +364% since 2019 by trading one quiet hour of the day. We rebuilt its rules from the trade history, measured the edge on nine years of data, and turned it into an Expert Advisor that is now being tested on raw-spread accounts.
Our verdict
The edge is real, specific and small. Prices of EURAUD and AUDCAD that stretch away from their 5-minute average between 16:00 and 16:40 New York time tend to snap back, and they do so far more reliably at that hour than at any other. The catch is size: it is worth about 2 pips a trade in live conditions, so it only survives on accounts whose spread at that hour is close to zero.
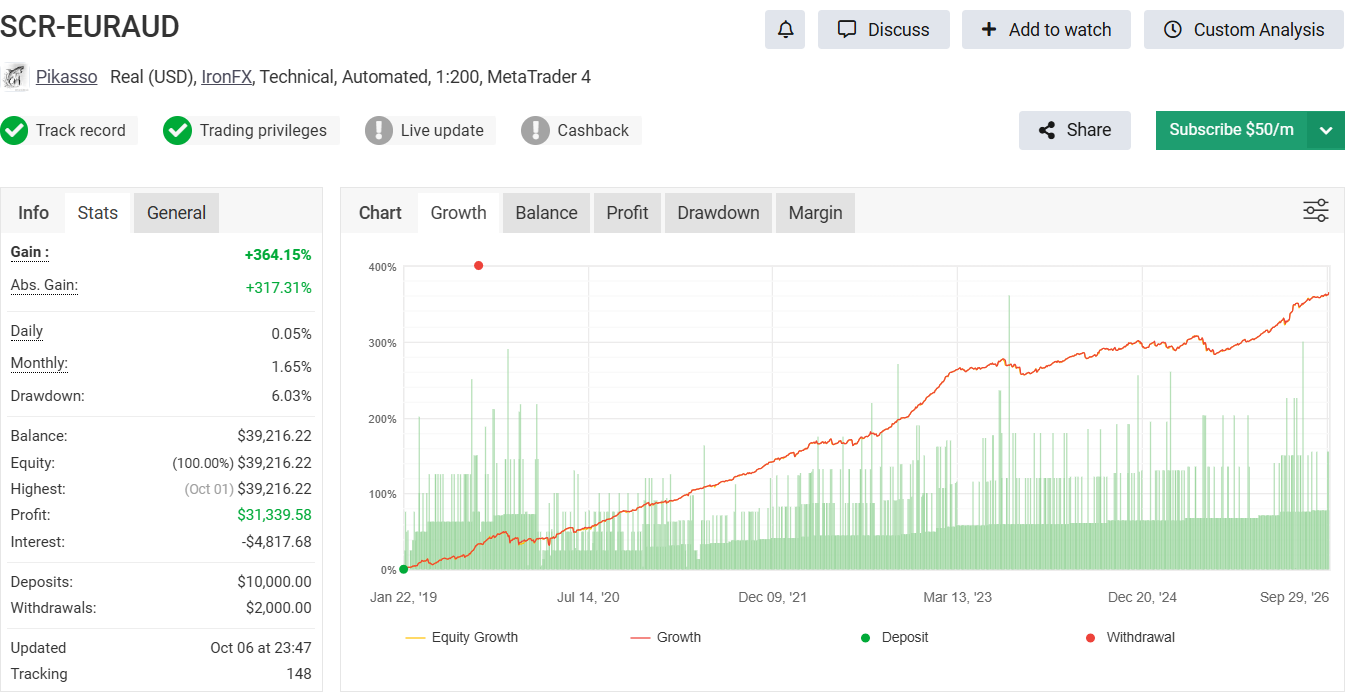
- A third-party live account has traded this pattern since January 2019: +364%, 1,836 trades, 6.03% maximum drawdown (Myfxbook).
- The same rule earns 3.9 pips per trade at 16:00 New York and 0.5 to 1.9 at every other hour, and it is positive at 16:00 in every year from 2018 to 2026.
- Our Expert Advisor matched the live account's direction on 103 of 109 shared EURAUD nights, and its backtest made money in 8 of 9 years.
- Costs decide everything. On a broker that widens the spread to 5 pips at 16:00 New York, the profit factor falls from 2.71 to 1.54 and almost every 2026 trade is blocked.
- 2025 was flat (−3.5%) and the backtest is still about 0.5 pips a trade more optimistic than the live account on the same nights.
01Where it started: a public account that only trades at night
The idea did not come from a chart. It came from a trading account. SCR-EURAUD, published on Myfxbook by a trader called Pikasso, is a real-money MetaTrader 4 account at IronFX that has been run by an automated system since January 2019. Myfxbook marks its track record and trading privileges as verified. We have no connection with the account and no access to its code; everything below was worked out from its public trade history.
Monthly gain of the live account, January to October 2026, as reported by Myfxbook.
What the headline number hides
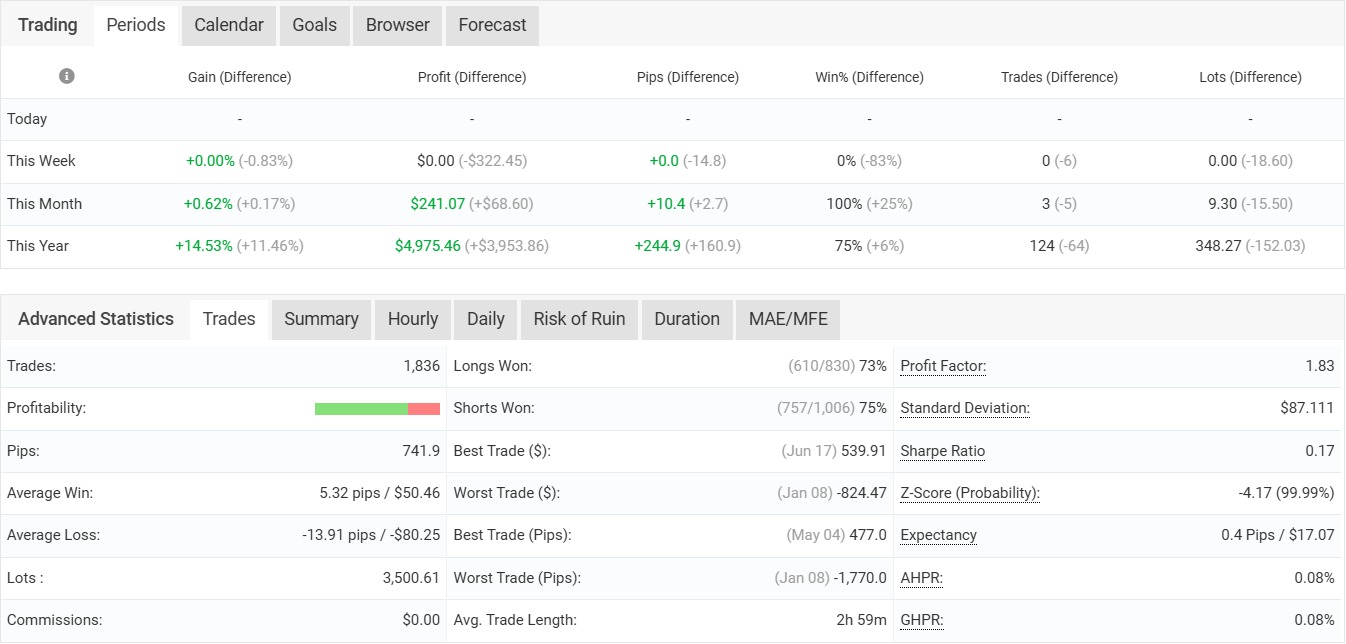
+364% is the result of seven years of compounding with a growing position size (3,500 lots traded in total). The edge per trade is much smaller than that figure suggests, and it is worth reading Myfxbook's statistics panel closely:
Small wins, larger losses
The average win is 5.32 pips and the average loss is 13.91 pips. The system wins three trades out of four and gives back much of it on the fourth.
0.4 pips a trade over seven years
Myfxbook's expectancy for the whole history is +0.4 pips per trade. In 2026 it is much better: +244.9 pips over 124 trades, about 2 pips a trade.
Swap is a real cost
Trades still open at the 17:00 New York rollover pay overnight financing. Over the account's life that came to $4,817.68.
02Reading the trade history: what the robot does
We took the account's most recent 200 closed trades (June 2025 to October 2026; 193 at full size and 7 small test trades) and lined every entry and exit up against one-minute price data. Three things stood out immediately.
Entry time of the 193 full-size trades, New York time, in 5-minute buckets. "Later" is 7 entries at 18:00, after the rollover, plus one each at 16:42 and 17:00. The account's broker runs its clock on a different time zone; converted to New York time, the window never moves.
Trades by New York weekday.
Why Wednesday is quieter, and Friday empty
A position open at the 17:00 rollover on Wednesday pays three nights of swap, and on Friday it is carried over the weekend. The account trades Wednesday half as often and never on Friday. The timing is measured; the reason is our reading of it.
It sells after a push up and buys after a push down
For every trade we measured what price had done just before the entry. The pattern is unambiguous: the system bets against the last 15 to 60 minutes.
| Before the entry (median) | Sells | Buys |
|---|---|---|
| Move in the previous 15 minutes | +3.2 pips | −3.5 pips |
| Move in the previous 60 minutes | +5.3 pips | −6.4 pips |
| Distance from the 5-minute average, in standard deviations | +1.45 | −1.53 |
| Where price sits in its last 4-hour range (0 = low, 1 = high) | 0.73 | 0.14 |
Entry: a stretched price
Price has moved about one and a half standard deviations away from its 5-minute average, outside a Bollinger band. The trade goes the other way.
Exit: back at the average
Winners and losers both close when price returns to the 5-minute average (median distance at exit: 0.2 pips). There is no fixed profit target.
Short holds
The median trade lasts 47 minutes and 61% are closed within the hour.
Illustration of the rule on a 5-minute chart, not real data.
What we could not reproduce. The live account trades on only about a third of the nights on which its own rule fires. Nights it chose to trade had more movement in the previous hour, so it probably uses a volatility filter, but we could not pin it down. Our Expert Advisor trades every qualifying night, which is why it makes more trades than the account.
03Is the edge real? The hour test
A rule that looks good on one account can be luck, a lucky year, or a pattern found in every market. The cleanest test is to run the exact same rule at different times of day. If buying and selling stretched prices simply works, it should work at any hour. If the edge belongs to 16:00 New York, only that hour should stand out.
Average pips per trade before costs when the same fade rule runs in a 40-minute window starting at each hour. EURAUD and AUDCAD, 2018 to 2026, 2,500 to 3,300 trades per hour. Research simulation at mid price.
Pips per trade before costs at 16:00 New York (red) against the average of the other seven hours tested (grey).
Show the numbers
| Year | 16:00 New York | Other hours (avg) |
|---|
Why it might work
The US day is over
At 16:00 New York the US stock market closes. Most of the world's FX desks have already gone home, and the Asia-Pacific session has not started. Liquidity is at one of its thinnest points of the day.
Moves without follow-through
In thin markets a modest order can push price away from fair value, and there are few new participants to extend the move. Prices drift back once the order is filled.
A clock running out
Dealers square positions before the 17:00 rollover. That flow tends to lean against late moves rather than add to them.
Measured versus inferred. The hour test and the yearly results are measurements. The explanation above is our interpretation of them; we did not observe dealers' order flow.
A data trap we removed. In our broker's price history for 2015–2017, the price collapses for a few minutes at every 17:00 rollover. A simulated sell that "closed" during that collapse showed +29 to +68 pips, a profit no one could have filled. Including those years made the edge look nearly twice as big (6.66 instead of 3.93 pips a trade). Every figure in this report starts in January 2018, after the problem disappears from the data.
04What we claimed, and what the data says
| Claim | What we tested | Result | Status |
|---|---|---|---|
| The account trades a fixed window | Entry times of 193 trades, converted to New York time | 184 of 193 between 16:00 and 16:40; 7 at 18:00, after the rollover | Supported |
| It fades a stretched 5-minute price | Our rule's direction against the account's on the same nights | Same direction on 151 of 169 nights (89%) | Supported |
| The edge belongs to 16:00 New York | Same rule at 8 different start hours, 2018–2026 | 3.93 pips at 16:00 vs 0.54–1.86 elsewhere | Supported |
| It is not one lucky year | 16:00 result year by year | Positive in all 9 years, 1.72 to 7.11 pips | Supported |
| It works on any broker | The same EA on three cost models | Profit factor 3.70 (raw), 2.71 (2.8-pip all-in), 1.54 (5-pip night spread) | Not supported |
| Buys and sells work equally well | Backtest split by direction | Sells PF 3.03, buys PF 1.74 with a 10.8% drawdown | Partly supported |
| The backtest matches live trading | Our trades vs the account's on shared nights | EURAUD 2.16 vs 1.64 pips; AUDCAD 1.46 vs 1.09 pips | Partly supported |
05How we turned it into an Expert Advisor
Because the rule is simple and the account is public, we are publishing it in full, including the source code. Night Scalper EA follows the same five steps every weekday evening.
Wait for the window
16:00 to 16:40 New York, Monday to Thursday. Christmas and New Year week are skipped.
Measure the stretch
A 20-period Bollinger band on the 5-minute chart, including the candle still forming.
Fade it once
Price 1.5 standard deviations above the average: sell. Below: buy. One trade per pair per night.
Protect it
30-pip emergency stop, 6-hour time limit, skip the entry if the spread is above 3 pips.
Exit at the average
Close when price touches the 5-minute average again, but never between 16:55 and 17:10.
What we added to the original
An emergency stop
The live account uses none. In our test, the AUD flash crash of 3 January 2019 cost a single EURAUD trade 171 pips without a stop. A 30-pip stop cut the worst equity drawdown from 24.6% to 7.0% for about 12% less profit. It was hit on 48 of 3,052 trades.
A rollover blackout
At 17:00 New York, spreads widen at every broker for a few minutes. The EA will not close at the average between 16:55 and 17:10; the stop still works.
A holiday skip
Trades opened on 24 or 31 December were held for three days over the holiday close. The EA skips 24 December to 1 January.
A self-setting clock
Every broker shows a different time. The EA reads the broker's clock from the moment FX reopens on Sunday at 17:00 New York, so no time inputs need changing.
We stamped the same 2018–2026 prices onto three different broker clocks and ran the EA on each.
| Broker clock | Example | Trades | Same New York entry and exit |
|---|---|---|---|
| New York + 7 hours | Many MT5 brokers | 1,501 | 1,501 |
| UTC, no daylight saving | Exness | 1,501 | 1,501 |
| UTC+2 / +3, European daylight saving | The source account's broker | 1,501 | 1,501 |
| UTC, with the old fixed "New York + 7" setting | What a wrong clock costs | 1,637 | none |
06Spreads decide everything: why this needs a raw-spread account
An average trade is worth about 2 to 4 pips before costs. The spread is paid on every trade, so the size of the spread between 16:00 and 18:00 New York decides whether the strategy works at all, and brokers differ enormously at exactly that time.
Median EURAUD spread in points (10 points = 1 pip) by New York hour, June 2025 to September 2026, on the demo server used for our backtests (amber; the 17:00 bar reaches 126 points and is cut off). Green: what a raw-spread account showed on 7 October 2026 at the three hours that matter.
Profit factor of Night Scalper EA, 2018–2026, standard settings.
| Cost model | EURAUD return | EURAUD PF | AUDCAD return | AUDCAD PF |
|---|---|---|---|---|
| Raw spread: 1 pip plus $7 per lot commission | +258.8% | 3.70 | +135.9% | 2.53 |
| 2.8 pips all-in (used for this report) | +223.8% | 2.71 | +97.1% | 1.86 |
| Demo server's real spread (5+ pips at night since 2025) | +76.4% | 1.54 | +31.2% | 1.30 |
Returns are on a $10,000 balance with 0.8 lots per pair, no compounding. On the demo server, the EA's 3-pip spread limit blocked all but five trades in 2026.
The spread schedule you need
| New York time | Server time, New York + 7 | Exness time (UTC), summer | Raw-spread account | What happens |
|---|---|---|---|---|
| 16:00–16:40 | 23:00–23:40 | 20:00–20:40 | near 0 points | Entry window |
| 17:00 | 00:00 | 21:00 | 12–25 points | Daily rollover; the EA does not close at the average from 16:55 to 17:10 |
| 18:00 | 01:00 | 22:00 | near 0 points | Most trades are already closed |
Raw-spread figures were observed by our team on a live Exness raw-spread account on 7 October 2026. They are a single observation, not a measured average. Exness time moves one hour later (21:00 to 21:40 for the entry window) after US daylight saving ends on 1 November.
This strategy does not work at every broker. On a standard account, or at a broker that widens spreads before the rollover, the costs take most of the edge. Before you run it, open a 1-minute EURAUD chart between 16:00 and 16:40 New York on a few weekdays and check the spread. If it is regularly above 10 points (1 pip), this strategy is probably not for that account.
Two brokers with raw-spread accounts
Exness
The broker we are forward-testing on. After you register, open a Raw Spread account (not Standard); the EURAUD spread in the entry window was close to zero when we checked.
Open an Exness accountInstaForex
An alternative with a raw-spread account type. After you register, choose the raw-spread account and confirm the night-time EURAUD spread yourself before trading.
Open an InstaForex accountPartner links: Trading Kernel may receive a commission if you open an account through them. It costs you nothing extra and does not change our results. Raw-spread accounts charge a commission per lot; include it when you judge the costs.
07Backtest results
Figures come from the MetaTrader 5 Strategy Tester. Each pair was tested on its own $10,000 account; the combined view adds the two trade lists together. The tester ran on our demo server's price history with the spread replaced by a fixed 2.8 pips, a level we chose because it reproduces the live account's results on the nights both traded (section 08).
| MT5 report | Profit factor | Recovery factor | Win rate | Max equity DD | Max balance DD | Sharpe (MT5) |
|---|---|---|---|---|---|---|
| EURAUD | 2.71 | 20.20 | 74.48% | −7.02% | −6.30% | 17.26 |
| AUDCAD | 1.86 | 5.33 | 60.67% | −8.73% | −8.31% | 8.61 |
Hypothetical performance. Backtested results have inherent limitations. Unlike an actual performance record, simulated results do not represent actual trading, and because the trades were not actually executed, results may under- or over-compensate for market factors such as liquidity, spread and slippage. No representation is made that any account will or is likely to achieve results similar to those shown.
Explore the backtest
Conventions follow the MT5 report: a trade with profit plus swap of zero or more counts as a win; profit factor is gross profit divided by gross loss; drawdown is measured on closed trades from the highest balance reached. Position size is 0.8 lots per pair per $10,000 at 1×; the account and size controls rescale every trade, so percentages stay comparable. The MT5 equity drawdowns in the table above include open-trade movement and are slightly larger.
Year by year
2026 runs to 2 October. Percentages are of the starting balance of the selection.
Month by month
| Year | Jan | Feb | Mar | Apr | May | Jun | Jul | Aug | Sep | Oct | Nov | Dec | Year |
|---|---|---|---|---|---|---|---|---|---|---|---|---|---|
| 2018 | +3.9 | +4.0 | +10.4 | +8.4 | +9.6 | +10.2 | +4.4 | +8.7 | +8.2 | +6.4 | −1.5 | +1.9 | +74.6 |
| 2019 | −0.4 | +1.5 | +5.6 | −1.8 | −1.3 | −1.0 | −1.8 | −1.1 | +3.3 | +2.6 | −0.3 | −4.3 | +1.0 |
| 2020 | −0.7 | −2.5 | +17.8 | +1.1 | +2.8 | +4.7 | +2.1 | +3.7 | +5.8 | +5.0 | +5.8 | +2.0 | +47.5 |
| 2021 | +4.0 | +1.0 | +10.7 | +4.9 | +3.0 | +2.2 | −0.3 | +5.8 | +3.1 | +1.5 | +7.8 | +3.5 | +47.2 |
| 2022 | +3.5 | +2.9 | +8.6 | 0.0 | +5.4 | +3.2 | +11.1 | +17.0 | +11.1 | +10.9 | +16.7 | +3.0 | +93.4 |
| 2023 | +5.6 | +4.8 | +2.2 | +0.1 | +1.3 | +1.8 | +2.2 | +0.7 | +2.1 | +0.3 | −1.5 | +2.5 | +22.3 |
| 2024 | +3.2 | +6.1 | +9.8 | +6.1 | +0.1 | −2.6 | −1.8 | +1.0 | −1.0 | −0.2 | −1.3 | +1.4 | +21.0 |
| 2025 | +2.1 | +0.4 | −5.3 | −0.1 | +0.9 | −3.1 | −2.2 | −0.7 | +0.7 | +2.4 | +0.3 | +1.0 | −3.5 |
| 2026 | −1.5 | +0.8 | +7.5 | +3.2 | +0.8 | +2.9 | +2.2 | +1.1 | +0.1 | +0.2 | +17.4 |
How trades ended
Back at the average
3,003 trades · 98.4%
Average +$13.42 (+2.8 pips). This is the strategy's exit plan.
Emergency stop
48 trades · 1.6%
Average −$169.00 (−30 pips). The safety net, not the plan: one stop cancels about 13 average exits.
Time limit
1 trade
−$94.46 after six hours. Almost every trade is resolved long before the limit.
08The backtest against the live account
We compared every trade our EA would have taken from June 2025 to October 2026 with the live account's trades on the same nights.
| Pair | Nights both traded | Same direction | Live pips / trade | Backtest pips / trade | Gap |
|---|---|---|---|---|---|
| EURAUD | 109 | 103 | +1.64 | +2.16 | −0.52 |
| AUDCAD | 42 | 41 | +1.09 | +1.46 | −0.37 |
The direction agrees almost every time, and the trade-by-trade results are correlated (0.51 EURAUD, 0.50 AUDCAD). The live account still earns about half a pip a trade less than our backtest. Some of that is the live account's own costs and fills; some is that it exits slightly differently. We chose the 2.8-pip cost model because it brings the backtest this close; a cost model of 1 pip made the backtest about twice as optimistic as the live account. Expect live results somewhat below the figures in section 07.
Our EA also trades on nights the live account skips. On those nights it averaged +1.24 pips on EURAUD and +0.57 pips on AUDCAD: still positive, but weaker, which supports the idea that the account uses a filter we have not identified.
09Robustness
Every row is a run or split we actually tested. Cells are shaded when the profit factor falls below 1.5 or the drawdown exceeds 10%.
| Cut | Cost model | Net return | Profit factor | Max DD | Trades |
|---|---|---|---|---|---|
| Standard settings, split | |||||
| Both pairs, 2018–2026 | 2.8 pips | +320.8% | 2.32 | −3.34% | 3,052 |
| First half, 2018–2021 | 2.8 pips | +170.3% | 2.37 | −6.09% | 1,445 |
| Second half, 2022–2026 | 2.8 pips | +150.6% | 2.27 | −5.69% | 1,607 |
| Sells only | 2.8 pips | +222.3% | 3.03 | −1.29% | 1,463 |
| Buys only | 2.8 pips | +98.6% | 1.74 | −10.76% | 1,589 |
| EURAUD only | 2.8 pips | +223.8% | 2.71 | −6.30% | 1,501 |
| AUDCAD only | 2.8 pips | +97.1% | 1.86 | −8.31% | 1,551 |
| Parameter neighbors (EURAUD / AUDCAD, MT5 equity DD) | |||||
| Entry at 1.0 standard deviation | 2.8 pips | +192.8% / +55.8% | 2.18 / 1.38 | −10.42% / −13.82% | 1,749 / 1,763 |
| Entry at 1.5 (standard) | 2.8 pips | +223.8% / +97.1% | 2.71 / 1.86 | −7.02% / −8.73% | 1,501 / 1,551 |
| Entry at 2.0 standard deviations | 2.8 pips | +193.0% / +88.5% | 3.64 / 2.25 | −2.19% / −5.74% | 924 / 1,005 |
| No emergency stop | 2.8 pips | +253.4% / +100.6% | 3.41 / 1.92 | −24.63% / −18.14% | 1,501 / 1,551 |
| Wider rollover blackout (16:45–18:10), no stop | 1 pip + commission | +167.9% / +42.4% | 1.99 / 1.24 | −21.67% / −14.17% | 1,508 / 1,548 |
| Costs (EURAUD / AUDCAD) | |||||
| Standard settings | 1 pip + commission | +258.8% / +135.9% | 3.70 / 2.53 | −1.50% / −1.59% | 1,508 / 1,548 |
| Standard settings | Demo server, 5+ pips | +76.4% / +31.2% | 1.54 / 1.30 | −9.12% / −8.63% | 1,161 / 1,246 |
Splits of the standard run use closed-trade drawdown; neighbor and cost rows use the MT5 report's equity drawdown. The 1-pip cost runs add $7 per lot commission after the test. The wider-blackout runs were made before the emergency stop was added, so compare them with each other, not with the standard rows.
What held up
Both halves of the period, both pairs, all three entry thresholds and the strictest cost model that still allows trading are profitable. The 2.0 entry threshold gives a smoother curve with fewer trades; we kept 1.5 because it matches the live account.
What did not
Buys are much weaker than sells. Most of the edge is captured in the minutes around 17:00: forbidding exits from 16:45 to 18:10 cuts AUDCAD from +139.9% to +42.4% and EURAUD from +271.6% to +167.9% (both without the stop, 1-pip costs). On a broker with wide night spreads the edge is mostly gone.
10What could break it
Every result in sections 07 to 09 is a hypothetical backtest of Night Scalper EA v1.10 with standard settings, a fixed 2.8-pip cost and fixed position sizes. None of it is a live record.
- Thin edge. In recent years the average trade earned about 3 to 4 pips before costs in our research, and about 2 pips after costs on the live account. A spread or slippage of 2 extra pips per trade removes most of it.
- Broker dependence. On a broker with a 5-pip night spread, the profit factor falls to 1.54 (EURAUD) and 1.30 (AUDCAD), and the spread limit blocks almost every 2026 trade.
- Quiet years. 2019 made +1.0% and 2025 lost 3.5% on both pairs combined. AUDCAD lost money in both of those years. Half of all profit came from 2018 and 2022.
- Worst periods. Worst month: March 2025, −5.3%. 25 of 106 months lost money. Up to 8 losing trades in a row.
- Stops are large compared with wins. A stop costs 30 pips ($169 on average at test size), about six average winning trades ($27.40 each). In fast markets a live stop can fill worse than 30 pips; the backtest assumes it fills exactly.
- Optimistic by about half a pip. On nights both traded, the backtest beat the live account by 0.52 pips a trade on EURAUD and 0.37 on AUDCAD.
- Data quality. The test uses one-minute bars (MT5 history quality 59%), not real ticks, so fills inside each minute are estimated.
- Swap. Trades still open at 17:00 New York pay overnight financing, three times on Wednesday. The live account paid $4,817.68 in seven years.
- No guarantees. The pattern has lasted at least nine years. That does not mean it will last another one.
11Status: in testing
Night Scalper EA is a research release. It is not a finished product, and we are not presenting these results as something you should expect.
Running now
A forward test on an Exness raw-spread account started on 7 October 2026, with the EA's automatic clock reading the broker correctly.
What would confirm it
100 or more forward trades averaging at least 1 pip after all costs, with fills close to the backtest on the same nights.
What would end it
Forward results below 1 pip a trade after costs, or real fills that are routinely worse than the backtest by more than a pip.
We will publish the forward-test results here, good or bad, once the test is concluded, together with the full trade list and a comparison against the backtest for the same nights.
A good fit if you…
- have, or are willing to open, a raw-spread account with a near-zero EURAUD spread between 16:00 and 16:40 New York
- want a small, frequent edge that is in the market for under an hour a night
- are comfortable testing on a demo or the smallest size first
Probably not for you if you…
- trade on a standard account or a broker that widens spreads before the rollover
- would stop after a flat year: 2025 lost 3.5% and 2019 made 1.0%
- cannot accept a single stop that wipes out six average wins, or 8 losses in a row
12Download the Expert Advisor, free
Night Scalper EA, version 1.10 (testing)
MetaTrader 5, compiled .ex5 and full source .mq5, 51 KB zip
Setting it up
- Open a raw-spread account with a broker whose EURAUD spread is near zero from 16:00 to 16:40 New York (see section 06). Start on a demo or with the smallest size.
- In MetaTrader 5, open File, Open Data Folder, go to MQL5, Experts, and copy the unzipped Night Scalper EA folder into it. Right-click Expert Advisors in the Navigator and choose Refresh.
- Open a EURAUD chart (any timeframe), drag the EA onto it, tick Allow Algo Trading, and switch on the Algo Trading button. For the second pair, repeat on an AUDCAD chart.
- Check the clock line on the chart. It should read "auto: server = NY+4" on an Exness account until 1 November (NY+5 after), or "NY+7" on brokers whose clock runs seven hours ahead of New York. The New York time shown must match the real New York time.
- Set the position size. The tests used 0.8 lots per pair on a $10,000 balance. The EA's default is 1.0 lot; change InpLots, or turn on InpScaleWithBalance.
Settings
| Input | Tested value | What it does |
|---|---|---|
| InpClock | Auto | Reads the broker's clock from the Sunday reopen; manual modes are available |
| InpStartNY / InpWindowMin | 960 / 40 | Entry window: 16:00 New York for 40 minutes |
| InpBBPeriod / InpBBDev | 20 / 1.5 | 5-minute Bollinger band and the stretch needed to enter |
| InpStopPips | 30 | Emergency stop in pips (0 turns it off) |
| InpMaxHoldMin | 360 | Closes any trade after six hours |
| InpBlackoutFrom / To | 1015 / 1030 | No exits at the average from 16:55 to 17:10 New York |
| InpLots | 0.80 | Fixed size per trade (default 1.0; check it before you start) |
| InpMaxSpreadPoints | 30 | Skips an entry if the spread is above 3 pips |
| InpMon–InpFri | Mon–Thu on | Trading days by New York date; Friday is off |
| InpSkipXmas | true | No entries from 24 December to 1 January |
| InpMagic | 160016 | Identifies the EA's trades |
13Questions
Is this the same strategy as the Myfxbook account?
It is our reconstruction of it. It trades the same window, in the same direction on 89% of nights, and exits the same way. The live account skips about two thirds of the nights our EA trades, probably with a filter we could not identify, and it has no stop loss. We do not have its code.
Why does it only work on raw-spread accounts?
The average trade is worth a few pips, and between 16:00 and 18:00 New York many brokers widen their spreads. On our demo server the spread is about 5 pips at that hour, which turns a 2.71 profit factor into 1.54. A raw-spread account quotes close to zero in the entry window and charges a fixed commission instead.
Do I need to change any times for my broker?
No. Version 1.10 works out the broker's clock from the weekly market reopen and shows what it found on the chart. If the line says "NOT DETECTED YET", the EA waits for the next Sunday reopen before trading.
Should I trade both pairs?
EURAUD carries most of the result: profit factor 2.71 against 1.86 for AUDCAD, which lost money in 2019 and 2025. Running EURAUD alone is the more conservative choice; adding AUDCAD roughly doubles the number of trades for a smaller gain per trade.
Why are sells so much better than buys?
In the backtest, sells made a profit factor of 3.03 and buys 1.74. The live account's win rates are similar for both directions (75% and 73%), so we have not filtered buys out; it is one of the things the forward test will tell us.
Can I run it on a prop-firm or a funded account?
Check that account's spread in the entry window first; most of them do not offer raw pricing at 16:00 New York. Every firm has its own rules. Check yours. No EA can guarantee that you will pass.
Night Scalper: a real edge, priced in pips
One quiet hour, one simple rule, and nine years of evidence that it works at 16:00 New York and nowhere else. Whether it works for you depends almost entirely on your broker's spread at that hour.
| Markets | EURAUD, AUDCAD |
| Window | 16:00–16:40 New York, Monday to Thursday |
| Style | 5-minute mean reversion, one trade per pair per night |
| Exit | Back at the 5-minute average; 30-pip emergency stop |
| Account type | Raw spread only |
| Status | Forward test running since 7 October 2026 |
Research and Expert Advisor by Trading Kernel LLC. The trading idea comes from the third-party SCR-EURAUD account on Myfxbook (Pikasso); Night Scalper EA is our independent reconstruction and is free to download. Trading Kernel is non-custodial: software runs in your own terminal on your own broker account; we never hold funds or trade on your behalf. Research and education, not investment advice.
Risk disclosure
Trading foreign exchange, CFDs and other leveraged products carries a high level of risk and may not be suitable for all investors. You may lose some or all of your investment. All performance figures on this page come from a hypothetical backtest, except the Myfxbook figures, which belong to a third-party account. CFTC Rule 4.41: hypothetical or simulated performance results have certain limitations. Unlike an actual performance record, simulated results do not represent actual trading. Also, since the trades have not actually been executed, the results may have under- or over-compensated for the impact, if any, of certain market factors, such as lack of liquidity. Simulated trading programs in general are also subject to the fact that they are designed with the benefit of hindsight. No representation is being made that any account will or is likely to achieve profits or losses similar to those shown. Past performance is not indicative of future results. Nothing here is investment advice or a solicitation. You are solely responsible for your trading decisions and for complying with the rules of any broker or prop firm you use.