
By Trading Kernel Research · Tested 9–10 November 2026 · Updated 10 November 2026
Institutional SMC Robot is one of the newer gold Expert Advisors on the MQL5 Market. It is rated 4.81 stars from 24 reviews. Its live signal is up more than 100%, and its backtest is an almost straight line. On paper it has everything a buyer looks for. So before anyone spends $599 on it, we ran the one test that separates a strategy that reads the market from a backtest that only works on the calendar it was built on.
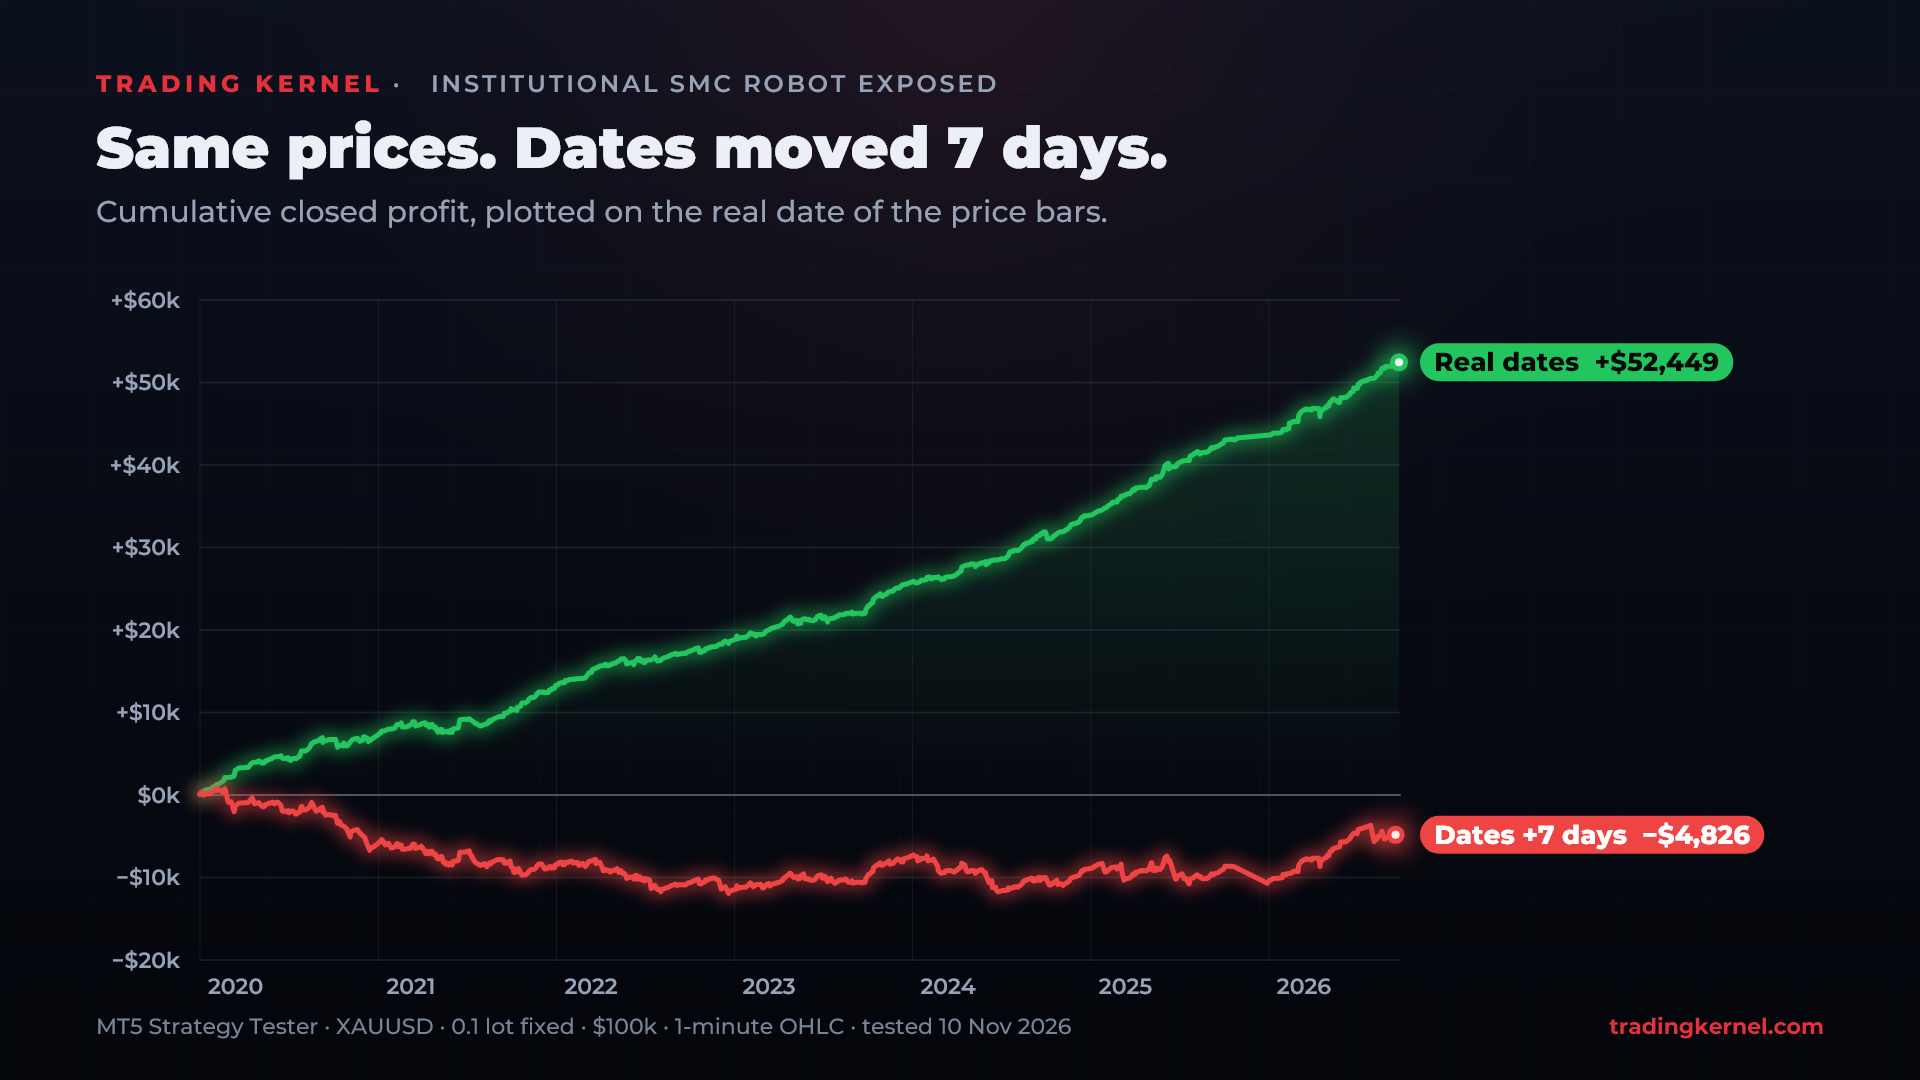
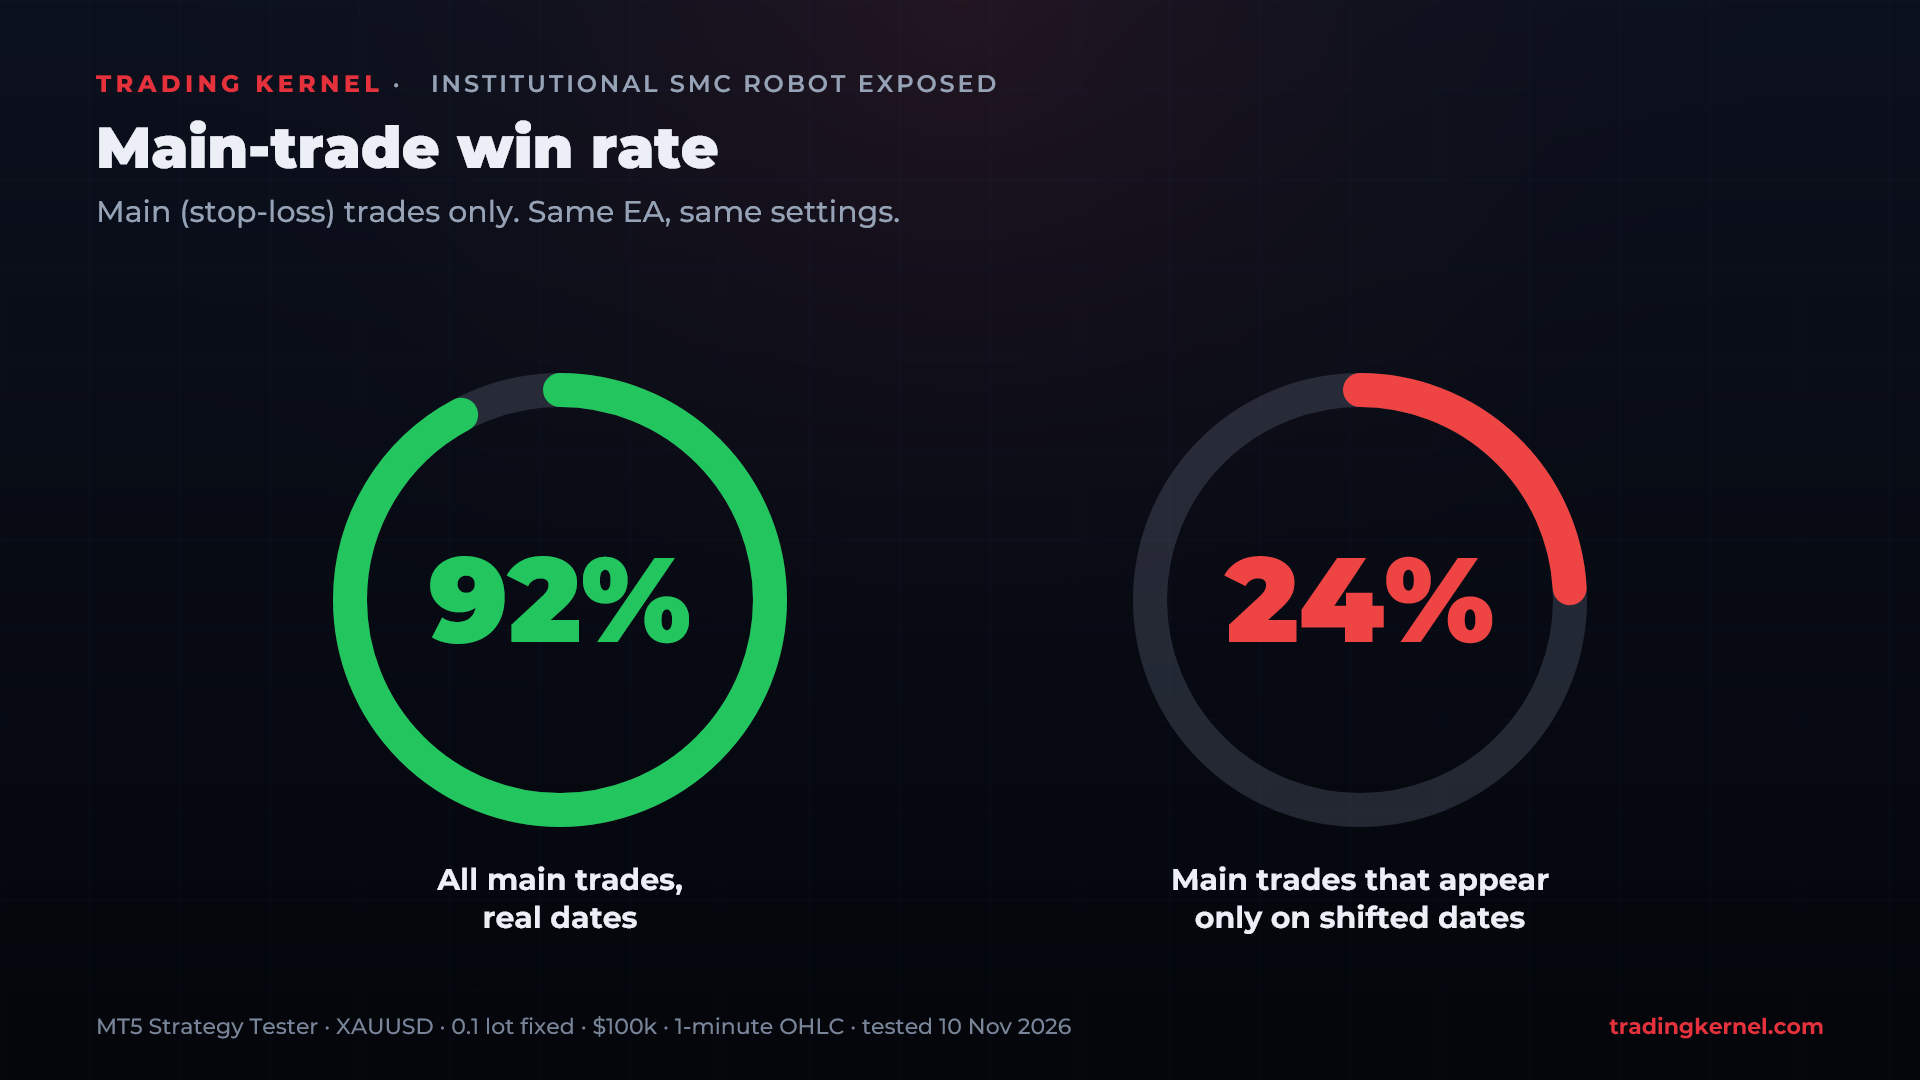
The short answer: the backtest does not hold up. We gave the EA the exact same gold candles twice: once on their real dates, and once with every date moved seven days later. On the real dates it made +$52,449 (2020–2026, 0.1 lot). On the shifted dates it made −$4,827.
Changing the prices changed nothing, and switching off the news filter changed nothing. Only moving the date broke it. A strategy that trades price cannot tell those two data sets apart, so this backtest cannot be trusted to show what the EA does on a live account.
What Institutional SMC Robot is
Institutional SMC Robot is sold on the MQL5 Market by VUJCIC INVESTMENTS COMPANY, the seller account of Dragoljub Vujcic, based in Italy. The account lists six products and eight signals. The robot was published on 23 July 2026, so at the time of writing it is less than four months old.
| Item | On the MQL5 page, 10 November 2026 |
|---|---|
| Price | $599 to buy · rent $199 for 1 month or $399 for 1 year · free demo |
| Rating | 4.81 stars from 24 reviews · 136 comments |
| Version | 3.50, updated 8 November 2026 |
| Demo downloads / activations | 1,993 / 17 |
| Markets | 9 built-in set files: gold (H1), Nasdaq (M30), Bitcoin (M15), forex (H1) |
| Default set | "XAUUSD Pyramiding" on XAUUSD H1 |
The price has moved quickly. In a comment on 16 August the seller announced a "special promotional price" before the robot went "back to the regular $299". On 30 September the comments advertised "Last days to get 50% off" and "NEXT PRICE USD599". In other words, the stated regular price went from $299 to $599 in about six weeks.
The version history moved just as quickly. The comments mention v1.2 in July, v1.8 and v1.9 in September, v2.1 at the end of September, v3.0 on 6 October, v3.2 in late October and v3.5 on 9 November. That is at least six updates in under four months, most of them asking buyers to download new set files.
The description promises a full Smart Money Concepts engine. It reads market structure through swing highs and lows, confirms trades with a Break of Structure (BOS) or Change of Character (CHoCH), and filters entries by unmitigated Order Blocks (OB) and Fair Value Gaps (FVG), with Quasimodo levels (QML) also mentioned. Stops are placed at the local swing and targets by a risk-to-reward ratio. On top of that come a trailing stop, a "profit-based pyramiding" engine that adds to winning trades, a news filter for NFP, CPI and FOMC, and prop-firm drawdown guards.
The robot sells itself on gold, so that is what we tested: the default "XAUUSD Pyramiding" set on XAUUSD H1. The seller's own backtest instructions point to the same set.
How the robot actually trades
A description tells you what an EA is supposed to do. The trade list tells you what it really does. We ran the default gold set on our broker's XAUUSD data from January 2018 to September 2026 at a fixed 0.1 lot and read every one of its 2,098 trades. Here is what the robot does, in plain terms.
It enters at the open of an hourly candle, nowhere else. All 1,081 main trades opened exactly on the hour, in both directions: 577 buys and 504 sells. Counting the adds, it opens about five positions a week.
The stop goes behind the swing, and the target mirrors it. The typical stop sits about $25 from the entry, and four trades in five have a stop between $11 and $80 away. The take profit is always the same distance as the stop, a 1:1 risk-to-reward, on every single main trade.
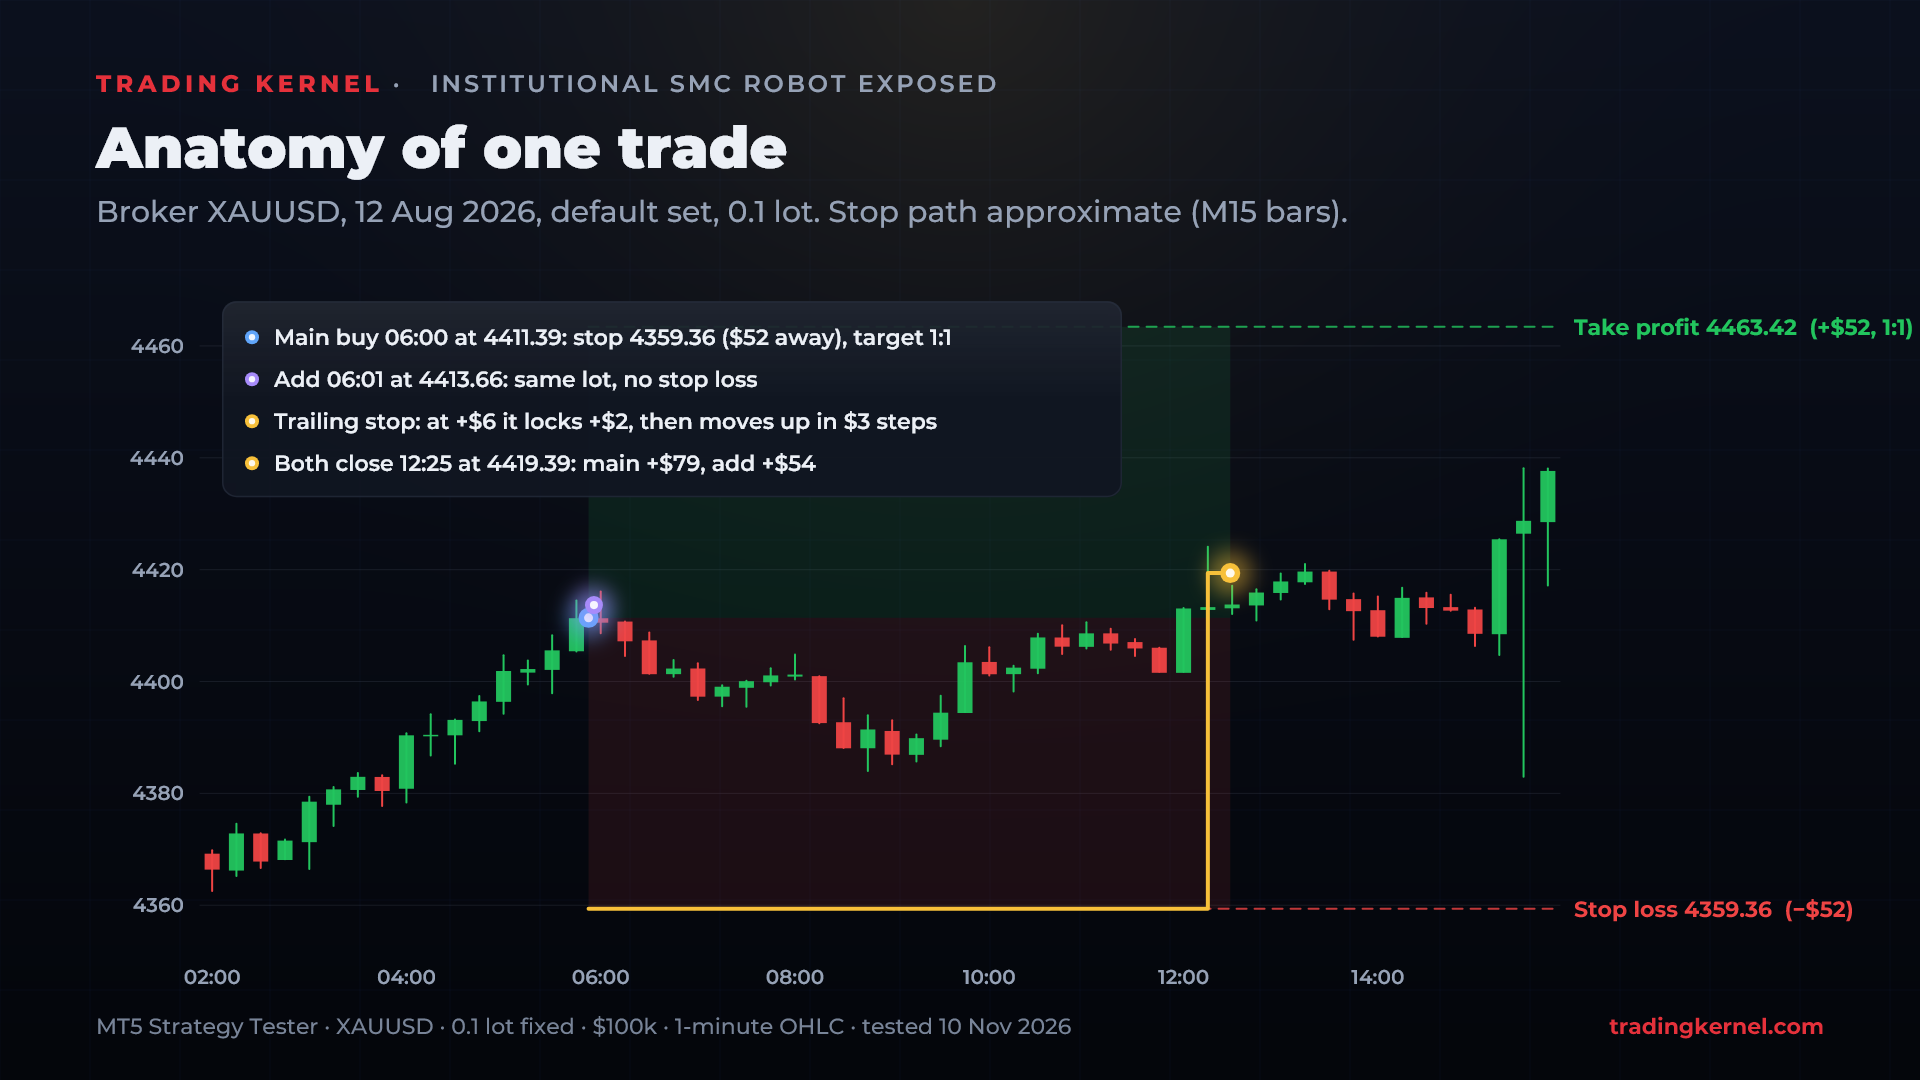
The trailing stop does most of the closing. Once a trade is $6 in profit, the stop jumps to lock in +$2, and then it follows price in $3 steps. That is why only 91 trades ever reached their take profit. Of the 990 trades that ended at their stop, 841 closed in profit, because by then the stop had been trailed into profit.
The "pyramid" add has no stop loss. When the main trade is $2 in profit, the robot opens one more position of the same size. All 1,017 of those adds opened with no stop loss of their own. They close when the main trade closes, so their risk depends entirely on the main trade's stop. They won only 50.5% of the time.
No grid and no martingale. The robot never held more than two positions at once and never added to a losing trade. The reviews that praise this are right.
Taken together, these rules give a very specific shape of results:
| Main trades, broker XAUUSD 2018–2026, 0.1 lot | Value |
|---|---|
| Win rate | 86.2% |
| Average winning trade | +$61.7 |
| Average losing trade | −$147.5 |
| Win rate needed just to break even | 70.5% |
| Median time in a trade | 6.2 hours |
| 9 in 10 trades closed within | 67.6 hours |
That is a high-win-rate, small-win, big-loss profile. One reviewer described it accurately: "When it hits the SL it can be a big loss but it has a very high win rate." A profile like this always feels great day to day, because most days are green. Whether it makes money depends entirely on whether the win rate stays well above about 70%. Keep that number in mind for the live signal and for the test results.
The default lot size
Out of the box, the gold sets size trades by balance, and the default risk level is called "EXTREME". In the seller's own words (comment #133, 9 November): "EXTREME (default) 0.01 lot every 150 of balance". On a $100,000 test account, that means 6.66 lots on the first trade, and our test reached 10 lots. In the next comment the seller warns that the EXTREME and VERY HIGH levels "are very risky and can wipe out the account".
That default sizing is what makes the vendor backtest so dramatic. We ran it for June to September 2026 on XAUUSD and got +$370,545 in under four months, with a profit factor of 4.82, but also a 34.13% equity drawdown ($98,750). For every test that follows we used a fixed 0.1 lot, so that a trade in 2020 counts the same as a trade in 2026 and nothing gets hidden by compounding.
What buyers see: reviews and comments
The review section is overwhelmingly positive, and most of the praise is about the seller rather than the trading. Buyers mention fast replies, set files sent within minutes, a private Telegram group and patient help with installation. That support is real and worth acknowledging.
Look closer at when the reviews were written, though. Many come from the first days or weeks of use: "first day of testing… two profitable trades", "testing on a small live account for a few days now and the number of trades is only two", "testing the advisor on a demo account for a few days". For a robot that trades about five times a week and wins most of its trades by design, a few green days tell you very little.
One review sums up why we ran this test. A buyer wrote that they "did various reverse tests, different periods and it never failed, always at the end and so it was on the plus." That is exactly the problem: the backtest looks the same whichever period you choose. In the next sections we show why that is not reassuring.
There is one strongly negative review, about two large losses in a row, and the seller disputes it in the comments, saying the trades were still open at the time. We are not taking a side on that exchange. Nothing in our conclusion depends on it.
The 136 comments are mostly buyers asking for set files and the seller sending them, plus the stream of version updates. One comment from the seller is worth remembering for later. On 7 October he explained that a gold trade "was closed at a loss 30 minutes before a high-impact news release", and that "the Expert Advisor (EA) functioned correctly". The news filter clearly matters to how the robot is sold. As you will see, it plays no part in the backtest.
The live signal, read properly
The product page links three live signals: gold on Vantage, Nasdaq on FPtrading and forex on Vantage. The gold signal is the one that matches the backtest, so that is the one to read.
| "SMC Robot XAUUSD" signal (MQL5 signal 2389159), read 10 Nov 2026 | Value |
|---|---|
| Broker / leverage | VantageMarkets-Live · 1:500 |
| Started | 1 September 2026 (10 weeks) |
| Trades | 44 (37 won, 7 lost: 84.09%) |
| Growth shown | 116.03% |
| Money in the account | €100 initial · €420 deposited · €270 withdrawn · balance €412.96 |
| Profit | €162.96 |
| Average win / average loss | €6.41 / −€10.61 |
| Profit factor | 3.19 |
| Max drawdown | 27.57% by balance · 25.18% relative by equity |
| Subscribers | 0 (copying costs 500 per month) |
The signal is profitable so far, and it should be said plainly: 37 of 44 trades won. It also shows the same shape as the backtest, small wins and bigger losses (€6.41 against €10.61). With that payoff, the signal needs to win about 62% of the time to break even, and so far it has won 84%.
Three things put that result in context.
MQL5 itself flags it. The signal page carries the platform's own warnings: "This is a newly opened account, and the trading results may be of random nature" and "Too much growth in the last month indicates a high risk". The Nasdaq signal shows a maximum deposit load of 81%, and the three-week-old forex signal shows 136%.
It is a few hundred euros. The account started with €100; €420 was deposited and €270 withdrawn along the way. A 116% growth figure on a €100 start, with a 25–28% drawdown already behind it after ten weeks, is not the same thing as a 1.4% drawdown on $100,000.
Ten weeks cannot tell a real edge from no edge. This is the important one, and we can measure it. Later we show that once the date dependence is removed, the strategy underneath makes roughly nothing over 2020–2026. We took that "strategy without the help" (the shifted-date run) and cut it into every possible 10-week window. 45% of those 10-week windows were profitable, some by up to $4,019 at 0.1 lot. Its main trades still won 82% of the time, even though the money did not add up. A profitable ten weeks, with a high win rate, is roughly a coin-flip outcome even for a strategy with no edge.
So the live signal is not evidence against our test, and it is not evidence for the backtest. It is simply too short to decide anything. That is why most buyers decide on the backtest, and why the backtest is what we tested.
The 7-day test, explained
Here is the idea in one sentence: an EA that trades price should not care what the date is.
A Smart Money Concepts robot looks at candles. It looks at highs, lows, breaks of structure, gaps and order blocks. If you give it exactly the same candles but tell it they happened one week later, it should take exactly the same trades and make exactly the same money. Nothing about a break of structure changes because the calendar says the 9th instead of the 2nd.
So we built two copies of gold's price history in MetaTrader 5:
| Symbol | What it contains | What a price-based EA should do |
|---|---|---|
| XAUUSD | The broker's real gold data, with commission and swap charged. | The normal backtest every buyer runs. |
| XAUUSD_CPY | A custom symbol with an exact copy of the broker's 1-minute gold candles. Same prices, same dates, same spread on every minute. | Match the broker run (this is the control). |
| XAUUSD_SH7 | The same copy with every timestamp moved 7 days later. Same prices, same spread, same hours, same weekdays (a Monday is still a Monday). Only the calendar date changes. | Give the same result as the copy. |
Why does this catch anything? An EA that, in the Strategy Tester, behaves as if it knows which dates had losing setups is still working from the real calendar when you give it shifted data. Its timing no longer lines up with the candles, so it starts taking setups it would normally skip, and the backtest falls apart. A week is the cleanest shift there is: the market, the sessions and the weekdays all stay identical. Only the date is wrong.
We compare the copy with the shift, rather than the broker symbol with the shift, because custom symbols charge no commission or swap. That makes the copy slightly better than the broker run, so copy against shift is the fair, like-for-like pair. We checked that the copy really is the same backtest as the broker data. Over 2020–2026, the broker run made +$52,529 before costs from 1,733 trades, within $80 of the copy's +$52,449 from 1,736 trades. After commission (−$1,040) and swap (−$3,172), the broker run nets +$48,317.
Repeat it yourself
- Export your broker's XAUUSD 1-minute bars to a CSV: time, open, high, low, close, tick volume, spread.
- Make a second copy and add 604,800 seconds (exactly 7 days) to every timestamp. Change nothing else.
- In MetaTrader 5, create two custom symbols that copy XAUUSD's contract settings (Symbols → Create Custom Symbol), and import one CSV into each (Bars → Import).
- Run the EA on both with identical settings and a fixed lot. Use the same period, the same model and the same inputs.
- Compare the reports. A price-based EA gives you the same trades and, within a rounding error, the same profit.
The robot has a free demo, so anyone can do this before paying.
The results
Settings for every run: Institutional SMC Robot (the build that reports itself as version 3.3, downloaded 6 November 2026), default "XAUUSD Pyramiding" set, H1, model "1 minute OHLC", $100,000 deposit, 1:100 leverage, fixed 0.1 lot. Everything else was left at default. Test period: 1 January 2020 to 26 September 2026.
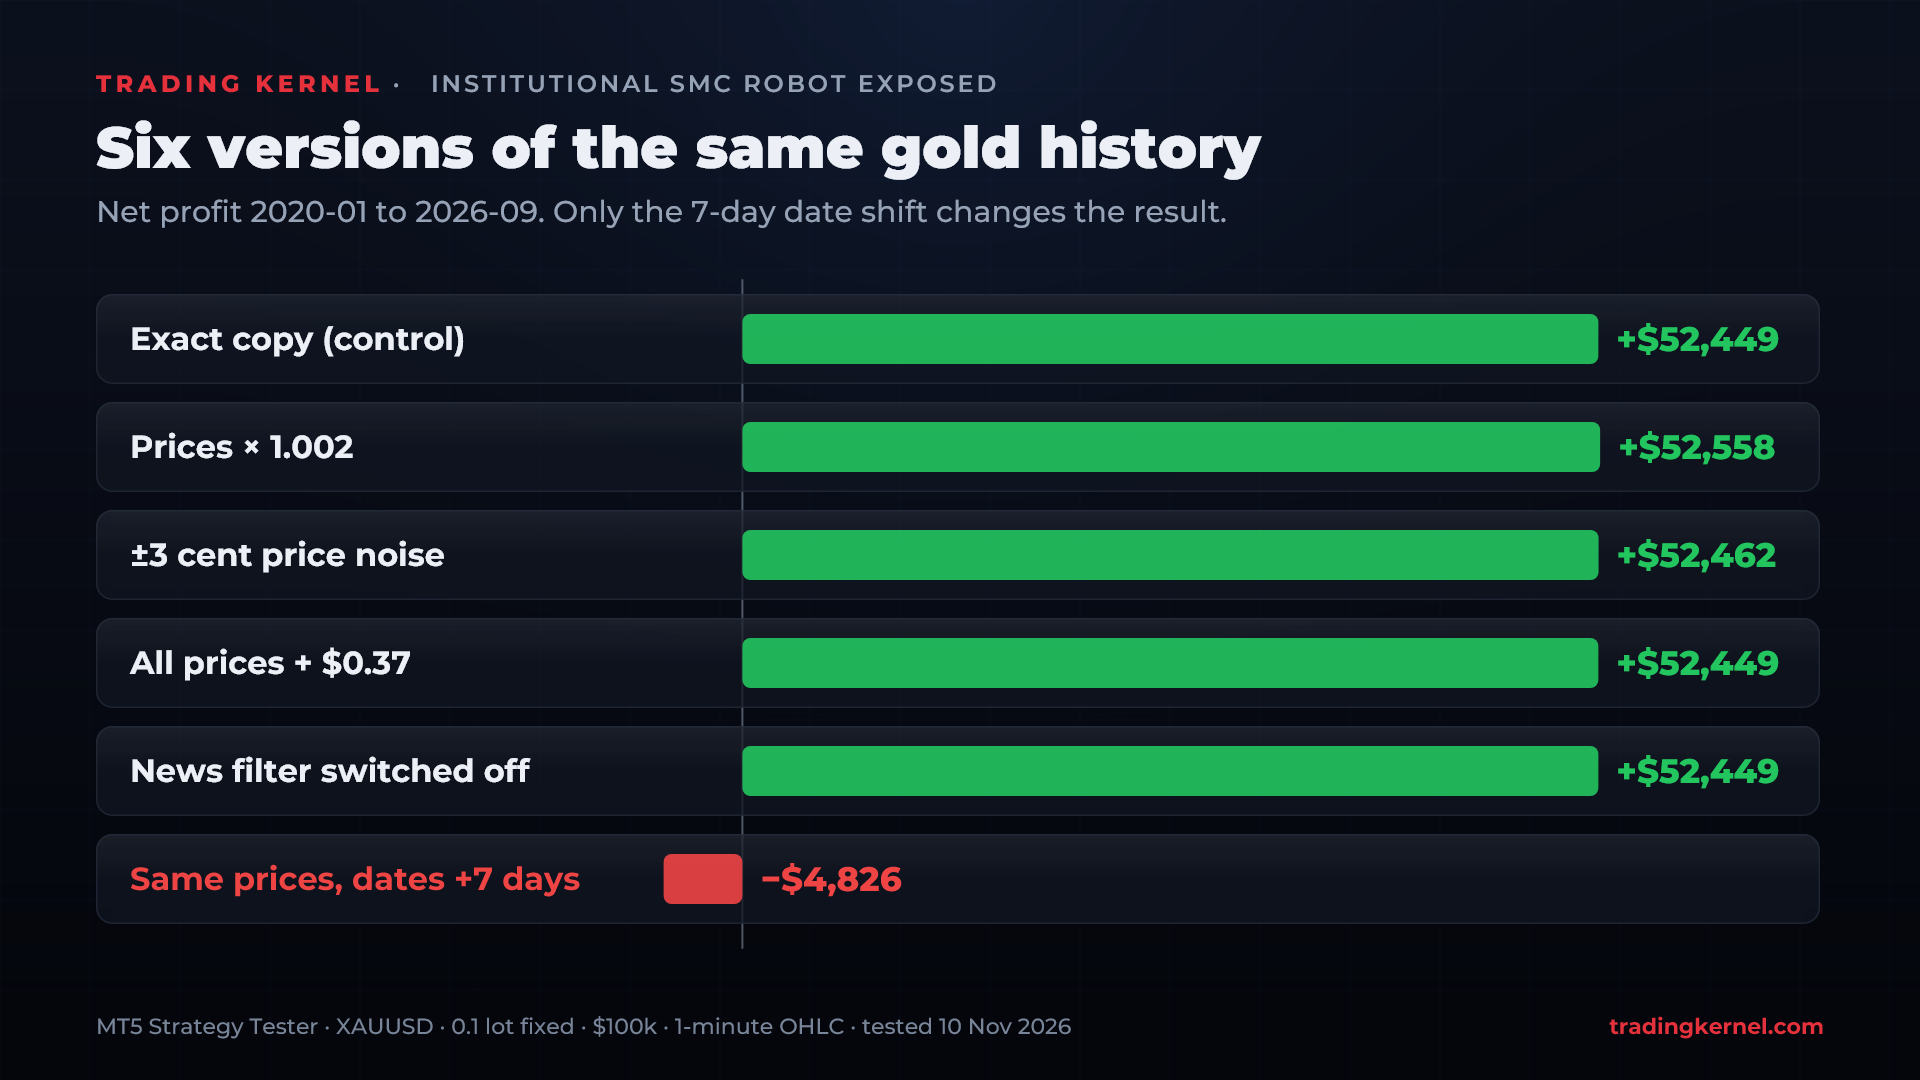
| Test (2020-01 to 2026-09, 0.1 lot) | Net profit | Profit factor | Trades |
|---|---|---|---|
| Exact copy (control) | +$52,449.20 | 2.83 | 1,736 |
| All prices × 1.002 | +$52,557.60 | 2.83 | 1,736 |
| ±3 cent random price noise | +$52,462.00 | 2.82 | 1,738 |
| All prices + $0.37 | +$52,449.20 | 2.83 | 1,736 |
| News filter switched off | +$52,449.20 | 2.83 | 1,736 |
| Same prices, dates +7 days | −$4,826.50 | 0.94 | 1,706 |
The first five rows are the important control. Scaling every price, adding random noise or shifting every price by 37 cents barely moves the result. The robot really is reading the candles, and small changes to them do not matter. The news filter row shows something else: the MetaTrader 5 Strategy Tester has no economic calendar, so the filter does nothing in a backtest. With it on or off, the copy and the shift produce identical reports, so the news filter is not what separates them.
Then the last row. Same candles, same spread, same settings, with the calendar moved one week, and the profit is gone.
| Report line | Copy (real dates) | Shift (dates +7 days) |
|---|---|---|
| Total net profit | +$52,449.20 | −$4,826.50 |
| Profit factor | 2.83 | 0.94 |
| Total trades | 1,736 | 1,706 |
| Winning trades | 72.47% | 66.18% |
| Gross loss | −$28,730.30 | −$78,328.30 |
| Max equity drawdown | $1,562 (1.43%) | $13,162 (13.04%) |
The tell is in the gross loss, which nearly triples. Most of the winners are still there. What changes is that losing trades appear that the real-date run never had. At its worst point, the shifted run was $11,915 below its starting balance, in December 2022.
Our video repeats the same test on a shorter window, starting in January 2024. On the broker's real-tick data the robot made +$32,408. The copy made +$26,713 and the shifted copy +$3,070. The two custom copies use 1-minute OHLC and end in late September, which explains most of the gap to the broker run. Between copy and shift, almost 90% of the profit disappeared with nothing changed but the date.
Where the profit went
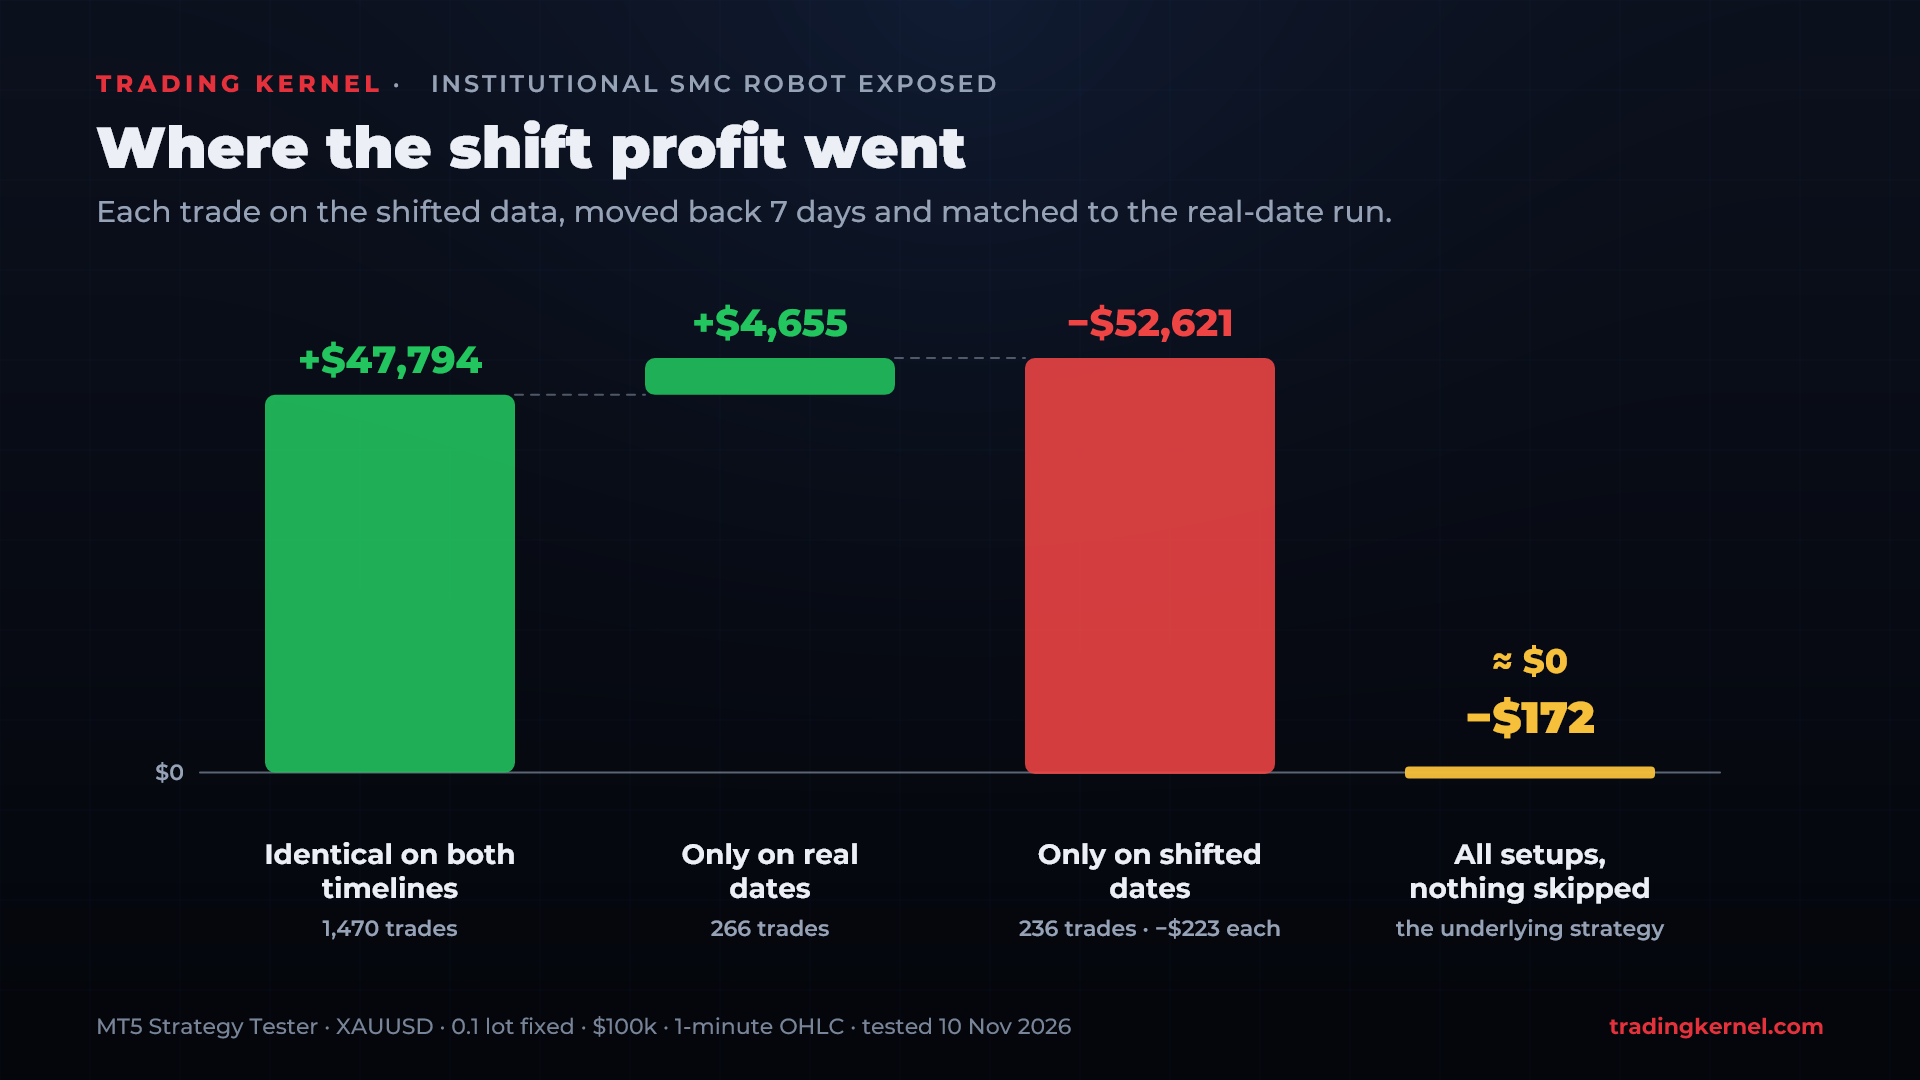
A headline number can hide a lot, so we went trade by trade. We moved every shifted trade back seven days and matched it to the real-date run, requiring the same direction, the same trade type (main or add) and an entry within two minutes. Every trade fell into one of three groups:
| Group | Trades | Profit |
|---|---|---|
| Identical on both timelines: same entry, same exit, same profit | 1,470 | +$47,794.50 on each |
| Only on the real dates | 266 | +$4,654.70 |
| Only on the shifted dates | 236 | −$52,621.00 (−$223 each) |
| All setups added together | −$171.80 ≈ $0 |
The 1,470 identical trades prove the test is working. When the robot takes a setup on both timelines, it gets the exact same result to the cent. For example, on the copy it bought at 16:00 on 2 January 2020 and made $126.30. On the shifted data it bought at 16:00 on 9 January 2020, the same candles one week later on the calendar, and made the same $126.30.
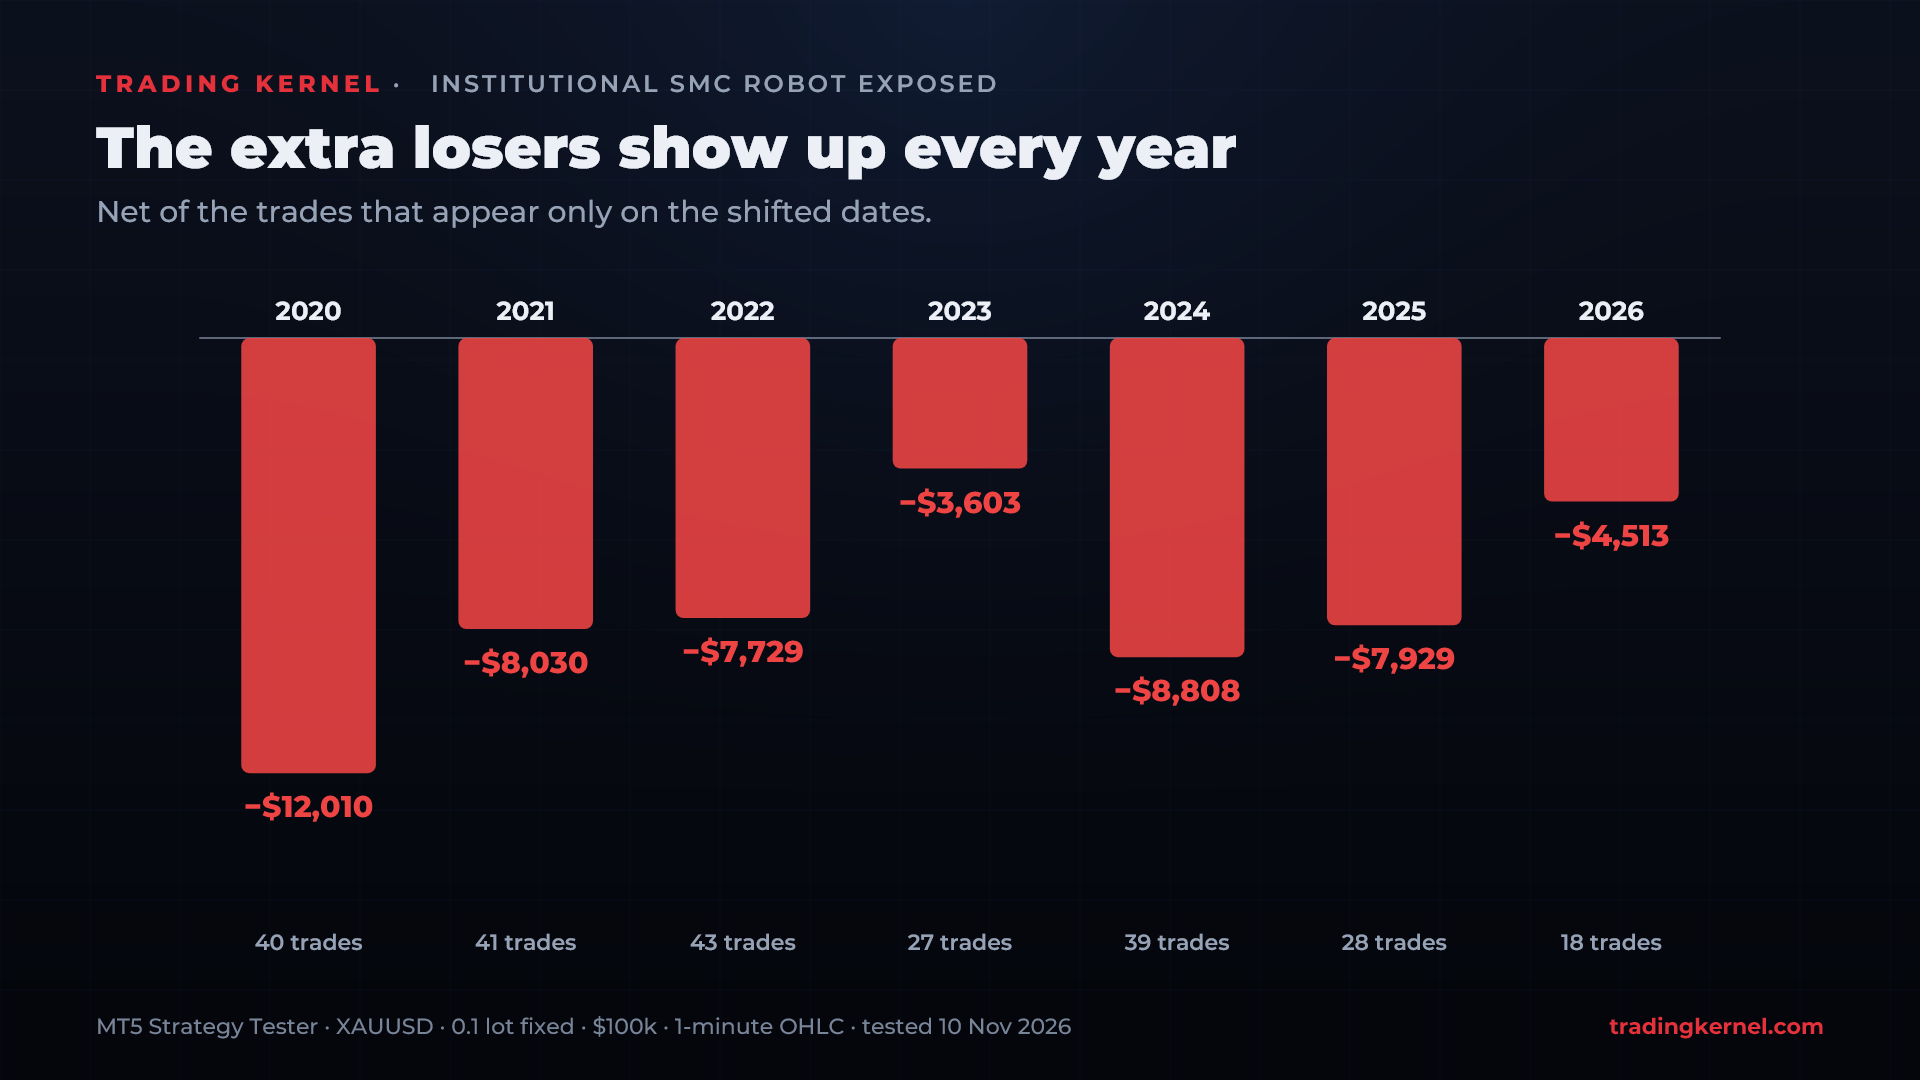
The difference is entirely in which setups get taken. The 236 trades that appear only on the shifted calendar are overwhelmingly losers:
Here is one of them. On the shifted data, the robot bought gold at 18:00 on 2 January 2026 at 4546.49. It lost $992.70 on the main trade and another $1,039.80 on its add, $2,032.50 in all. Those same candles sit on 26 December 2025 in the real-date run, and there the robot did not trade. In fact, the copy has no trades at all between 24 and 30 December 2025.
These extra losers are not one bad month and not a cluster around news. They show up in every year and on every weekday:
| Weekday | Mon | Tue | Wed | Thu | Fri |
|---|---|---|---|---|---|
| Shifted-only trades | 42 | 44 | 58 | 50 | 42 |
| Their net result | −$11,872 | −$9,629 | −$10,414 | −$10,276 | −$10,430 |
Only 3.0% of these trades are taken on candles from the first Friday of a month (US payrolls day), compared with 5.2% of all trades on the real dates. They are spread evenly, which is what you would expect if the robot is simply avoiding its own losing setups on the real calendar wherever they occur.
So the picture is this. On the real dates, the robot avoids the setups that would have lost. Put those setups back and the underlying strategy makes about nothing over almost seven years: $47,794 + $4,655 − $52,621 ≈ $0. This is the same pattern we found earlier in two other MQL5 gold robots, TitanForge and Morpheus, which failed the same 7-day test.
The broker years 2018–2019
There is one more way to see it, using nothing but the broker's own data. We ran the default set on real broker XAUUSD from January 2018, two years before the period most backtests show, with commission and swap charged.
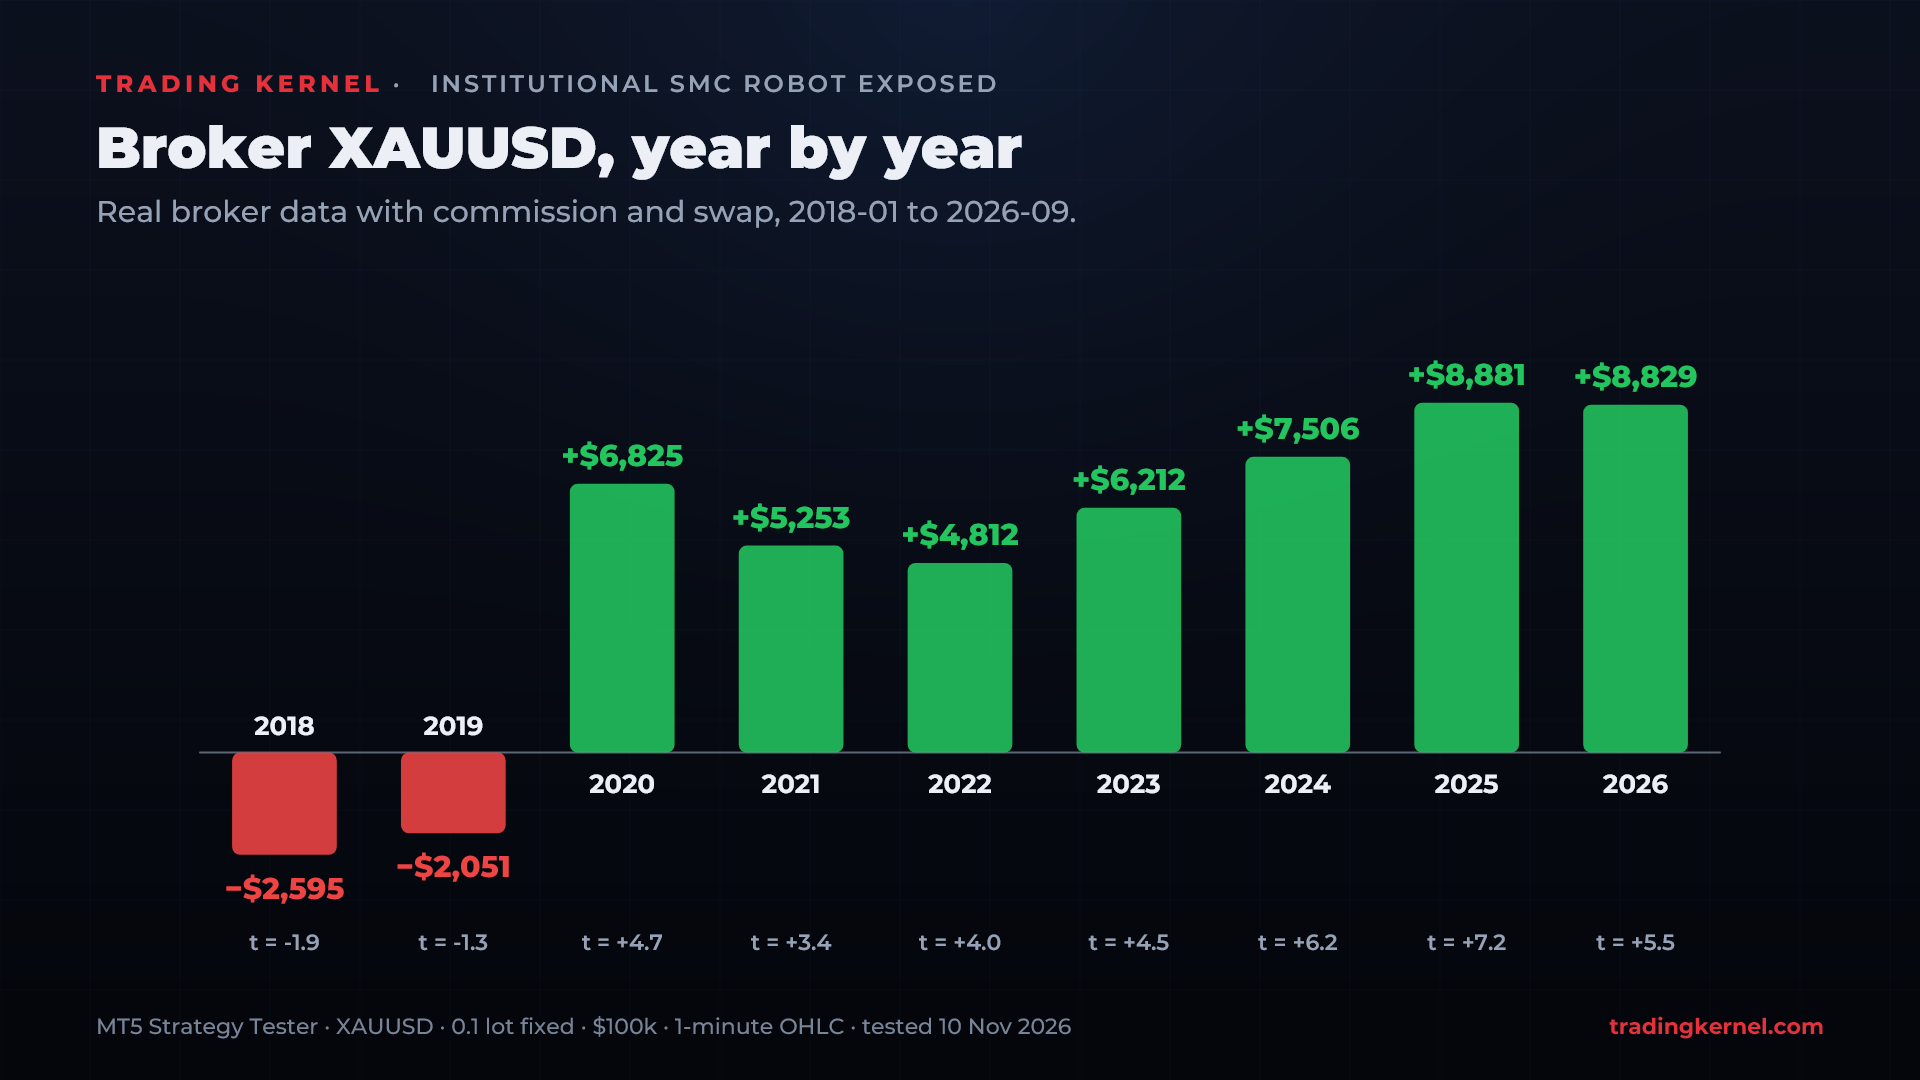
| Year | 2018 | 2019 | 2020 | 2021 | 2022 | 2023 | 2024 | 2025 | 2026* |
|---|---|---|---|---|---|---|---|---|---|
| Net | −$2,595 | −$2,051 | +$6,825 | +$5,253 | +$4,812 | +$6,212 | +$7,506 | +$8,881 | +$8,829 |
| t-stat per trade | −1.95 | −1.29 | 4.67 | 3.42 | 4.01 | 4.54 | 6.25 | 7.20 | 5.55 |
Over the whole period the robot made +$43,671 with a profit factor of 1.95 across 2,098 trades. The shape is the point, though: it loses in 2018 and 2019, then wins every year from 2020, mostly with very strong statistics (a t-stat above 3 is rarely luck). The same rules on the same market give a different result before 2020 than after. That fits what the shift test shows. On the stretch of history the backtest appears to be tuned to, it looks excellent. Outside it, it doesn't.
What this means for a live account
A backtest is only useful if it shows what the strategy will do on data it has never seen. Live trading is exactly that: tomorrow's candles, on tomorrow's date. No EA knows in advance which future setups will lose, so on a live account it cannot skip them. What a buyer gets live is the strategy without that help, which in our test is the roughly-zero result, not the +$52,449 line.
Live costs also come on top. The broker run paid about $4,200 in commission and swap over 2020–2026 at 0.1 lot. A strategy that makes about nothing before costs loses money after them.
And then there is the sizing. At the default EXTREME level of 0.01 lot per $150, a strategy whose average loss is about 2.4 times its average win is a lot of risk to carry on a strategy whose edge disappears when the date moves.
We are describing what the MetaTrader 5 Strategy Tester shows, not anyone's intentions. We tested the version 3.3 build. The current version is 3.50 and could behave differently, which is one more reason to run the test yourself on the current demo before you buy.
How to test any EA before you buy
None of this needs special software. Here is the checklist we run on every EA before it gets anywhere near our own product:
- Fix the lot size. Turn off auto-lot and compounding so every year counts the same. Exponential curves hide bad years.
- Run the copy and the 7-day shift. Same candles, dates +7 days. A price-based EA gives the same result. If the profit collapses, the backtest depends on the calendar.
- Change the prices slightly. Prices × 1.002, a few cents of noise, a fixed offset. A strategy that only works at one exact price level is a lookup table, not a strategy.
- Test the years before the advertised period. If the screenshots start in 2020, test 2018–2019.
- Read the trade list, not just the curve. Check for a stop on every position, the maximum number of open positions, adding to losers, and the average win against the average loss.
- Then confirm on real ticks. Trailing stops and tight targets can look far better on 1-minute OHLC than on real ticks.
Why Starter Pack is different
We built Starter Pack as the opposite of a backtest you have to take on trust. It is one MetaTrader 5 EA that holds a set of gold strategies, and every strategy inside it had to pass the same checks you just read, before it was allowed in:
- The 7-day shift test and the price tests. Our Gold Beaver strategy, for example, made +$60,951 on the shifted dates against +$60,625 on the copy, within 1%. That is what a strategy that reads price looks like.
- A risk screen. A stop loss on every trade, no grid, no martingale, no averaging down, no position without a stop.
- Real-tick verification in the MT5 Strategy Tester, so the results don't depend on 1-minute OHLC fills.
- A live account, published week by week on our Starter Pack review page.
Strategies that failed any of these never made it in, including some with backtests just as pretty as this one. You can run every test in this article on Starter Pack yourself, free, in the MT5 Strategy Tester.
See Starter Pack on tradingkernel.com →More research from the lab: The 16:00 New York fade: inside a seven-year EURAUD night scalper.
FAQ
Is Institutional SMC Robot a scam?
We don't make claims about anyone's intent. What we can show is that its backtest depends on the calendar date. With the same gold candles moved seven days later, a +$52,449 result becomes −$4,827, while price changes and the news filter make no difference. A strategy that trades price should not behave that way, so we don't consider this backtest a reliable guide to live results.
Does the Institutional SMC Robot backtest hold up?
Not in our tests. On the real dates (2020–2026, 0.1 lot) it shows +$52,449 with a 1.43% drawdown. With every date moved 7 days and nothing else changed, it shows −$4,827 with a 13.04% drawdown. The 236 trades that only appear on the shifted dates lose $52,621.
What is the 7-day date shift test?
You make two custom copies of a symbol's price history: an exact copy, and a copy with every timestamp moved 7 days later. The prices, spreads, hours and weekdays are identical; only the dates differ. An EA that trades price gives the same result on both. If the result collapses on the shifted copy, the backtest depends on the date.
Could the news filter explain the difference?
No. The MetaTrader 5 Strategy Tester has no economic calendar. With the news filter switched off, the copy and the shifted runs give identical results to the cent (+$52,449.20 and −$4,826.50).
The live signal is profitable. Doesn't that prove it works?
The gold signal had 44 trades over 10 weeks on an account that started with €100. That is far too short to decide anything. Even the strategy with the date dependence removed, which makes about nothing over 2020–2026, was profitable in 45% of all 10-week windows, with main trades still winning about 82% of the time. MQL5's own page also warns that the results "may be of random nature".
Does Institutional SMC Robot use martingale or a grid?
No. In our tests it never held more than two positions and never added to a losing trade. However, its pyramid "add" trades (1,017 of them on 2018–2026 broker data) open with no stop loss of their own and close together with the main trade.
What lot size does it use by default?
The default gold sizing is the "EXTREME" level: 0.01 lot for every $150 of balance, which is 6.66 lots on a $100,000 account. The seller's own comment warns that EXTREME and VERY HIGH "can wipe out the account".
Which version did you test?
The build that reports itself as version 3.3 (downloaded 6 November 2026), with the default "XAUUSD Pyramiding" set on XAUUSD H1. Version 3.50 was released on 8–9 November 2026. You can repeat the test on the current free demo with two custom symbols.
Sources
- Institutional SMC Robot on the MQL5 Market (reviews, comments), read 10 November 2026
- Seller: VUJCIC INVESTMENTS COMPANY (Dragoljub Vujcic) · all signals by this author
- Live signals: SMC Robot XAUUSD (2389159) · SMC Robot US100 (2389243) · SMC Robot Forex (2396091)
- Seller comments quoted: #19 · #100 · #101 · #115 · #133 · #134
- MetaTrader 5 Help: Custom financial instruments · Strategy Testing
Method and disclaimer. All results are hypothetical backtests from the MetaTrader 5 Strategy Tester on XSFintech demo XAUUSD data (custom symbols built from the same data). The tests were run on 9–10 November 2026, at a fixed 0.1 lot on a $100,000 account, unless stated otherwise. Product page, review, comment and signal details were read on 10 November 2026 and may have changed since. This article describes how the EA behaved in our tests and is not a statement about anyone's intent. Past performance does not guarantee future results. Trading leveraged products carries a high risk of loss. Nothing here is investment advice.