
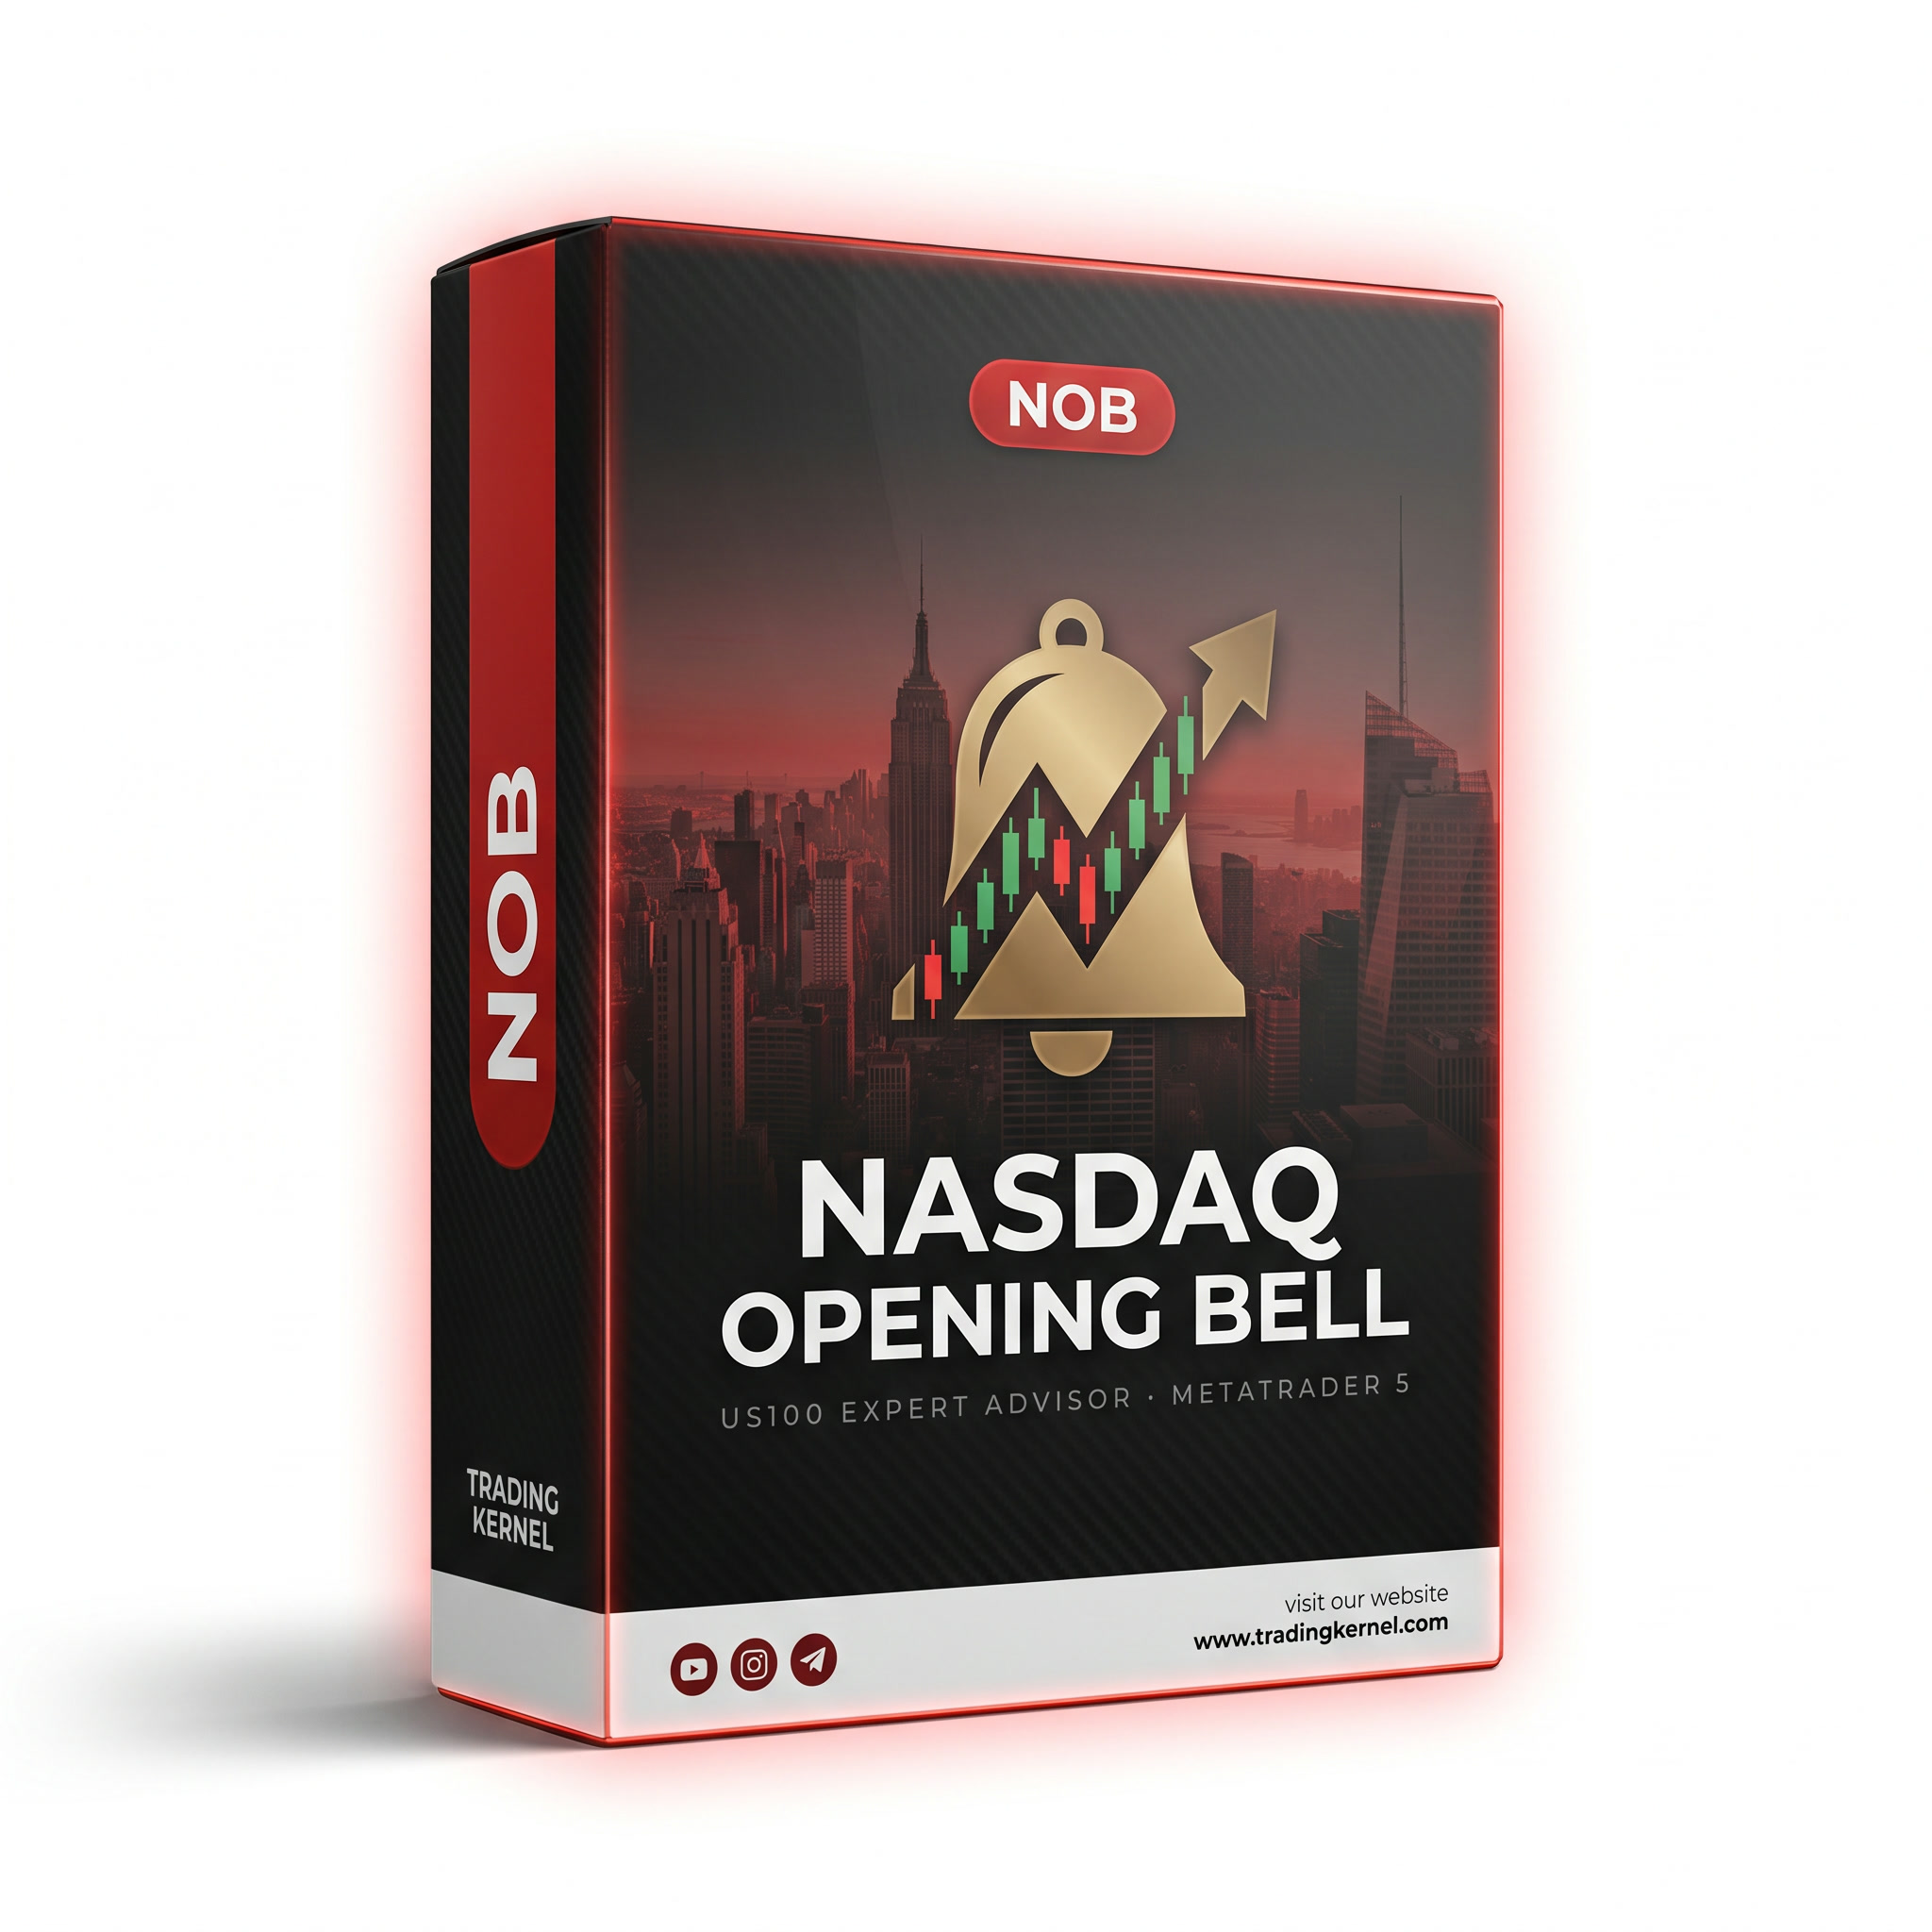
Nasdaq Opening Bell (NOB) is an MT5 expert advisor for the Nasdaq 100 (US100, NAS100, USTEC) that trades the New York cash open. When the opening auction is decisive, it follows the move with a stop order, a hard stop loss and a same-day exit. When the open isn’t decisive, it stays out. At most one trade a day, with no martingale, no grid and no overnight holds. Profitable in every calendar year 2018–2026 in MetaTrader 5 backtests, at a low 0.25% default risk.

Nasdaq Opening Bell EA (NOB)
99.00$
Need help or got any questions?
Nasdaq Opening BellNOB
One decision at the New York open. A hard stop from the first second. Flat the same day.
Nasdaq Opening Bell trades the most important moment of the Nasdaq 100 day: the opening auction of the New York cash session. When the open is decisive, it follows it with a stop order, a hard stop loss and a fixed exit later the same day. When the open is not decisive, it does nothing. In our MetaTrader 5 backtest it has been profitable in every calendar year since 2018.
Why the opening bell
At 09:30 New York time the US cash market opens with an auction. Orders that built up overnight, pre-market news and the first institutional flows of the day all meet in a few seconds. It is the densest burst of volume in the Nasdaq 100 day. When that auction resolves hard in one direction, the imbalance behind it rarely clears in a minute: it keeps pushing through the morning. Nasdaq Opening Bell exists to catch that follow-through, and only that.
The day’s biggest volume burst
The open is when the most real money changes hands at once. That is where a genuine, tradable imbalance shows itself most clearly.
Only decisive opens qualify
Most opens are noisy and two-sided. A strength test on the opening auction filters those out. On those days the EA places no order at all.
13 indices tested, one survived
We tested the same opening-auction idea on 13 stock indices. It held only on the Nasdaq 100. Moving the rule to later times of day removed the edge, so the edge belongs to the open itself.
Three kinds of day
Every New York trading day ends up as one of three things. The whole strategy is built around making the first one large and the second one small.
A decisive open that keeps going
Price confirms the move, the order fills, and the trend carries it through the morning. The trade is closed at a fixed time the same day. Big winners come from these days.
A false start
The open looks decisive, but price turns back. The protective stop closes the trade, usually within minutes, for a loss of about 1R (the amount you chose to risk).
No decisive open
The opening auction is weak or two-sided. No order is placed, and nothing is risked. That happens on roughly half of all trading days.
Read the open
At the New York opening bell the EA reads the opening auction of the Nasdaq 100.
Strength test
Only a one-sided, decisive open passes. Everything else is a no-trade day.
Wait for confirmation
A stop order waits at a confirmation level. If price never confirms within a set window, the order is cancelled.
Stop, then time exit
A hard stop is attached the moment the order fills. Whatever is left is closed at a fixed time the same day, never overnight.
The exact strength filter, levels and timings are part of the product and are explained in the user guide that comes with the EA. The EA trades long and short: 570 long and 483 short trades in the backtest, and both directions were profitable.
Nine years, one rule, no re-tuning
One rule set, unchanged, tested from October 2017 to October 2026 in the MetaTrader 5 Strategy Tester at the default risk of 0.25% per trade. The rule was found on part of the data, and the 2018–2019 years were kept back as a hold-out test. It was positive there too.
Account balance
$10,000 start · 0.25% risk · hover for detailDrawdown from the previous high
closed tradesMT5 Strategy Tester, US100 M1, “every tick” generated from 1-minute data (98% history quality), XSFintech spreads and commission, $10,000 start, 0.25% of balance risked per trade, compounding, 1 Oct 2017 – 17 Oct 2026. Backtests are hypothetical; see the disclosure at the bottom of this page.
Every full year in profit
The quiet years still finished positive, and none of the profit comes from a single lucky year. 2019, 2020 and 2023 were the slow ones. 2021, 2022, 2024 and 2025 were the strong ones.
Return per calendar year
0.25% risk per trade · compounding* 2017 covers October to December only (24 trades). 2026 runs to 17 October.
Every month since October 2017
71 of 109 months were positive. The best month was +9.6% and the worst was −3.2%. The losing months are small because every loss is capped by the stop. The winning months are where the large winners land.
Monthly return, with the yearly total
| Jan | Feb | Mar | Apr | May | Jun | Jul | Aug | Sep | Oct | Nov | Dec | Year | |
|---|---|---|---|---|---|---|---|---|---|---|---|---|---|
| 2017 | · | · | · | · | · | · | · | · | · | +0.1% | +0.5% | −0.9% | −0.3% |
| 2018 | +4.4% | +1.4% | +1.1% | +2.0% | +0.1% | −1.5% | +0.8% | +2.2% | −1.0% | +3.5% | −1.6% | −0.5% | +11.4% |
| 2019 | −0.4% | +0.3% | −2.8% | −1.3% | −1.2% | −0.1% | +1.3% | +0.9% | +4.3% | +2.0% | −0.3% | +1.6% | +4.0% |
| 2020 | +2.5% | +0.7% | −0.9% | +1.2% | +0.1% | −0.7% | +3.7% | +0.5% | −1.2% | +1.0% | −1.8% | −1.0% | +4.1% |
| 2021 | +6.0% | −1.4% | −2.3% | +2.0% | +2.1% | +4.1% | +5.0% | +2.4% | −0.4% | −0.3% | −2.6% | +3.0% | +18.5% |
| 2022 | +5.5% | +0.2% | −1.4% | −3.2% | +9.6% | −1.7% | −0.3% | +1.2% | +0.5% | +1.2% | +3.3% | +0.7% | +16.1% |
| 2023 | −0.7% | +0.1% | −1.2% | +1.5% | +1.4% | +1.9% | −1.8% | +4.2% | −2.3% | +2.7% | −0.2% | +0.3% | +6.0% |
| 2024 | −2.5% | −0.7% | +3.3% | +5.8% | +2.4% | −1.8% | +1.9% | +0.1% | +2.2% | +1.3% | +5.6% | +0.2% | +18.9% |
| 2025 | +0.7% | +2.0% | +2.0% | −2.2% | +1.9% | −0.8% | +1.5% | −1.0% | +1.9% | +3.9% | +5.8% | +1.7% | +18.4% |
| 2026 | −0.2% | +1.2% | +2.7% | +2.4% | +0.4% | +1.9% | −0.4% | +1.3% | +4.5% | +0.6% | · | · | +15.4% |
The month is the month a trade closed. Percent = that month’s profit as a share of the balance at the start of the month, at 0.25% risk. R = the sum of results in multiples of the amount risked (1R = one full stop-out), which does not depend on your risk setting. The yearly total compounds the months.
Lose small and often, win big and rarely
This is a trend-following strategy with a low win rate. Fewer than one trade in four wins, and that is by design. A loser is cut at about 1R, usually within minutes. A winner is held for hours. The few winners pay for all the losers, with something left over.
Per 100 trades: 22.7 wins × 5.36R ≈ +122R, and 77.3 losses × 1.04R ≈ −80R. That leaves about +41R per 100 trades, or +0.41R per trade on average.
The winners: how big they got
number of trades by result, in RNot shown: the 809 trades (77%) stopped out at about −1R, and 14 that closed near break-even. Each winner here paid for several of those, and 38 trades made 10R or more.
The best single trade made 25.8 times the amount risked.
Half of all winners made more than 4.2 times the risk.
The typical losing trade is stopped out about five minutes after it opens.
Of the trades still open at the time exit, 97% were in profit.
Figures in R come from the same 1,053-trade backtest. R is the result divided by the amount risked on that trade, so they hold at any risk setting. The loss average is slightly worse than −1R because of spread, commission and slippage.
Losing streaks are part of the deal
With a win rate near 23%, long runs of losing trades are not a malfunction. They are simple arithmetic. Traders most often give up on a strategy like this halfway through a normal losing streak, just before the winner that would have paid for it. Know these numbers before you start.
Longest losing streak in each year
number of losing trades in a row…5, 10 and 20 trades. Ten trades in a row without a single winner happens about 8% of the time.
The typical range is 10 to 20, with an average of 14. The longest in the backtest was 25 trades, in 2022, a year that still ended +16%.
For runs of 15, 20 and 25 losses, over a year of about 116 trades.
✅ Every trade is independent
These are base rates computed from the win rate. They describe what to expect over many trades. They do not predict the next one: after ten losses in a row, the next trade still has about a 23% chance to win, the same as always. At the default 0.25% risk, even the worst streak in the backtest (25 losses) cost about 6.3% of the account.
Why the default is only 0.25% per trade
The edge per trade is the same at any risk setting. What changes is how deep the drawdowns get. We set the default low on purpose, so that a normal losing streak stays easy to sit through.
| Risk per trade | Max drawdown | Cost of a 25-loss streak | Average year (2018–25) | Weakest / strongest year | Suits |
|---|---|---|---|---|---|
| DEFAULT0.25% | 10.8% | −6.3% | +12.2% | +4.0% / +18.9% | Most accounts. For a prop firm with a 10% max loss, use 0.15–0.2% |
| 0.5% | ≈16.7% | −12.2% | ≈+26.0% | ≈+7.9% / +42.4% | Traders comfortable with a 15–20% drawdown |
| 1% | 36.5% | −23.0% | ≈+55.8% | ≈+14.1% / +95.8% | Aggressive only. Expect a drawdown of a third of the account |
The 0.25% and 1% drawdowns are MT5 equity drawdowns from separate backtest runs. The 0.5% row and the 1% yearly figures are calculated by compounding the same 1,053 trades at that risk, and are marked ≈. Higher risk raises returns and drawdowns together; it does not improve the edge.
A dashboard that keeps you honest
A minimal panel in the corner of your chart shows what the EA is doing and what to expect. It is built for the hard part of this strategy: staying with it through a losing streak.
- State of the day: waiting, live, armed, in trade, done, holiday or weekend, with a countdown to the New York open.
- Today’s open: whether it passed the strength test and, if so, the order and its stop.
- P&L: today, and this EA’s whole history on your account.
- Odds panel: backtest vs your live win rate (with its uncertainty range), the chance of a win in the next 5, 10 and 20 trades, and your current streak against its normal range.
- Clock check: warns you if your broker’s clock does not match the setting.
Dashboard illustration with example values.
Set up once, then leave it
Hard stop on every trade
The stop loss goes in with the order. No position is ever open without one, and none is held overnight.
Three ways to set risk
Risk a percentage of your balance (default 0.25%), a fixed amount per trade, or a constant lot size.
Broker clock settings
Works with New York+7 servers, GMT+2/+3 servers on the European clock change, and fixed-offset servers. US daylight saving is handled for you.
Finds your Nasdaq symbol
It uses the chart symbol or finds US100, NAS100, USTEC or NDX on its own. Suffixes like .cash can be typed in.
Skips holidays and early closes
No trading on NYSE holidays or 13:00 early-close days, when the open behaves differently. The calendar is built in to 2028.
No licence key, any timeframe
Attach it to one chart of any timeframe. It works on hedging and netting accounts, and there is no licence or WebRequest setup.
Running in five steps
- Download the zip from your account. It contains
Nasdaq Opening Bell.ex5, the presetNasdaq Opening Bell - default.setand the user guide. - Copy the EA into MetaTrader 5: File → Open Data Folder → MQL5 → Experts, then refresh the Navigator (right-click Expert Advisors → Refresh).
- Open one chart of your broker’s Nasdaq 100 symbol (US100, NAS100, USTEC…). Any timeframe works.
- Attach the EA, load the preset if you like, and check Broker Server Clock (the user guide shows how in one minute). Make sure Algo Trading is on.
- Keep MetaTrader 5 running during the New York morning. A VPS is best. The EA must be running at the open to take the day’s trade, and later to close it.
No live track record yet, and we say so
Nasdaq Opening Bell is new. Everything on this page comes from the MetaTrader 5 Strategy Tester, not from a live account. We are not going to dress a backtest up as a track record. A public live account will be linked here once it has enough trades to mean something. With about 116 trades a year, a few months tells you that the EA runs as described, but not yet that the win rate holds.
The risk picture, in one place
⚠️ What you should know
- Backtests are hypothetical. All results shown are simulated in the MetaTrader 5 Strategy Tester. Your broker’s spread, commission, execution and data will give different results.
- Long losing streaks will happen. Runs of 10–20 losses are normal in a year, and 25 has happened. If you cannot sit through that, this is not the EA for you.
- The open moves fast. The New York open is the most volatile minute of the day. Slippage on entries and stops can be larger than at other times. A low-spread broker and a VPS are recommended.
- One market, one idea. Everything depends on the Nasdaq 100 open behaving as it has since 2017. A market regime can change.
- CFD trading carries substantial risk. There is no guaranteed profit. Trade only money you can afford to lose, and size your risk to your own account.
Straight answers
What exactly does it trade?
Why is the win rate so low?
Why don’t you publish the exact rules?
Does it use martingale, grid or hedging?
Which broker do I need? Does the server time matter?
Can I use it on a prop firm account?
Do I need a licence key or WebRequest?
Can I run it alongside other EAs?
How were the results produced?
One decision a day. A stop on every trade.
Nasdaq Opening Bell trades the follow-through of the New York open, and nothing else. Set your risk, attach it to one chart, and let the opening bell do the work.
Risk disclosure
Trading foreign exchange, CFDs and other leveraged products, including stock-index CFDs such as the Nasdaq 100 (US100), carries a high level of risk and may not be suitable for all investors. You may lose some or all of your investment. Past performance does not guarantee future results. Every result on this page is a Strategy Tester backtest. It is hypothetical and depends on tick quality, broker, spread and settings; your own results will differ. CFTC Rule 4.41: hypothetical or simulated performance results have certain limitations. Unlike an actual performance record, simulated results do not represent actual trading. Also, since the trades have not actually been executed, the results may have under- or over-compensated for the impact, if any, of certain market factors, such as lack of liquidity. Simulated trading programs in general are also subject to the fact that they are designed with the benefit of hindsight. No representation is being made that any account will or is likely to achieve profits or losses similar to those shown. Nothing here is investment advice or a solicitation. You are solely responsible for your trading decisions and for complying with the rules of any broker or prop firm you use.
No comments yet — be the first to share your experience.
You must be logged in to post a review.

Reviews
Clear filtersThere are no reviews yet.