
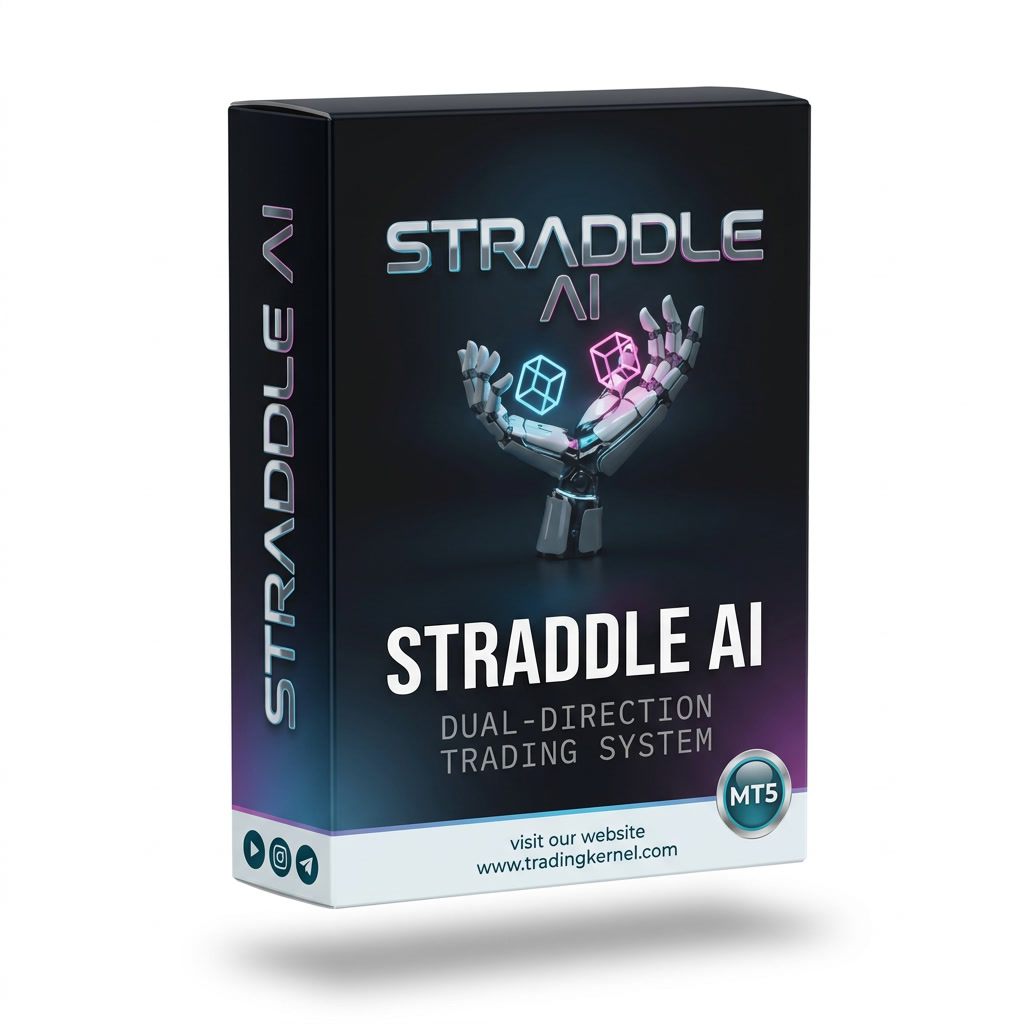
Straddle AI is a third-party two-sided straddle-grid EA for XAUUSD (MetaTrader 5). Over its 5-week tracked record it posted a 99% win rate and profit factor of 88 — numbers produced by holding losers open, not by cutting them: up to 1,699 concurrent positions, ~98% with no stop loss, some held over two weeks. That structure carries large hidden floating risk, so we retired it and removed it from the Starter Pack. Kernel verdict: high risk, not for prop. Published in full for transparency.


Straddle AI MT5
19.00$
Need help or got any questions?
We tested Straddle AI on a live account, then rotated it out of the Starter Pack around 21 August 2026. This page is kept up in full — numbers and all — as a record of why. Read it as a case study in how a perfect-looking track record can hide the real risk.
Straddle AI
A two-sided straddle-grid Expert Advisor for gold. It positions on both sides of price and, rather than cutting losers, holds positions open — accumulating a large basket of small, mostly stop-less trades and closing them together when the market finally moves its way. The structural facts below matter more than any headline number.
✅ Why we’re showing you a product we pulled
Trading Kernel reviews every EA on live data and publishes what we find, good or bad. Straddle AI is one we tested and decided not to keep. We could have quietly delisted it. Instead we’re leaving the whole record here, because the way its numbers look — and the reason those numbers are misleading — is one of the most useful things a gold trader can learn before buying any grid EA.
The track record looks perfect. That’s the problem.
Read straight off the closed-trade export, Straddle AI’s numbers are almost too good to be true. They are computed exactly — and they are exactly why we retired it.
🚩 How those numbers are manufactured
A 99% win rate and a profit factor of 88 are not evidence of a safe system here — they are the signature of a grid that never closes a loser. When a trade goes against it, Straddle AI doesn’t take the loss; it holds the position open and opens more. Positions were carried for as long as 15.6 days, and at one point 1,699 positions were open at the same time, with 98% of them carrying no stop loss.
Because losers stay open until they turn green (or are closed together in one big exit), the closed-trade curve looks smooth and the closed drawdown is tiny (just −$749.76). But the real risk — the floating, unrealised loss on that basket of up to 1,699 open positions — never appears in a closed-trade record at all. One sustained move against an un-stopped basket that size can erase an account before a single trade is booked as a loss. That is the risk a report like this cannot show you, and it is the risk that got this EA pulled.
The mechanics, from the record
Hedging
Holds opposing buy and sell positions on the same symbol at the same time — a two-sided straddle around price.
Near-fixed lot (0.01–0.06)
Lot size drifts only slightly across the period — consistent with equity-based sizing, not a doubling martingale progression.
1,699 open at peak
Far from “one at a time”: the basket grew into the thousands of open positions before the mass exit.
98% with no stop loss
Only about 2% of positions ran with a broker-side stop. The rest were left open and managed by exit logic, not a hard SL.
Hours to weeks
Many positions were held far beyond a normal scalp — the longest ran 15.6 days before closing.
XAUUSD / Gold
Tracked on gold. The EA is also marketed for indices and crypto, but this record is gold only.
Our call, and the numbers behind it
The closed record scores well on the surface. Our verdict weighs the structure, not the surface — and so does the marketplace that sells it.
Not recommended for live capital. Not for prop accounts.
A no-stop-loss hedging grid whose beautiful closed-trade record is a by-product of never realising losses. The unrealised risk on a basket of hundreds-to-thousands of open positions is real, large, and invisible in any closed-trade report. We rotated it out of the Starter Pack and do not recommend it for a funded, prop, or live account. If you run it at all, understand that you are carrying open-basket risk with almost no hard stops.
This measures only how meaningful the sample is — 1,730 trades over five weeks is enough to draw conclusions from. It is not a quality or safety score, and a high number here does not mean the strategy is sound.
The original vendor’s own public score. Buyer reviews report it performing on demo but losing on live, with the developer’s live signals removed. Shown here unedited.
Every figure, computed from the export
| Month | Trades | Win rate | Net |
|---|---|---|---|
| July 2026 | 8 | 75.0% | −$48.01 |
| August 2026 | 1,722 | 99.1% | +$132,883.85 |
| Week | Trades | Net |
|---|---|---|
| Week of Jul 27 | 8 | −$48.01 |
| Week of Aug 3 | 12 | −$323.79 |
| Week of Aug 10 | 9 | −$242.42 |
| Week of Aug 17 | 1,700 | +$133,662.34 |
| Week of Aug 24 | 1 | −$212.28 |
Note how nearly all of the profit lands in a single week — the week the accumulated basket was closed out. The weeks before it are flat-to-negative while losers were being held open.
| Exit type | Count | Net |
|---|---|---|
| Other | 1,703 | +$132,987.21 |
| Trailing stop | 18 | +$659.41 |
| SL hit | 9 | −$810.78 |
| Average win | +$78.48 |
| Average loss | −$84.87 |
| Largest win | +$90.30 |
| Largest loss | −$231.90 |
Show every losing trade — all 18 of them
| Open time | Dir | Lots | Open | Close | Pips | Net | Exit |
|---|---|---|---|---|---|---|---|
| 2026-07-27 19:30 | BUY | 0.02 | 4087.88 | 4052.86 | −350.2 | −$71.67 | SL hit |
| 2026-07-30 23:03 | BUY | 0.02 | 4116.11 | 4080.15 | −359.6 | −$73.58 | Other |
| 2026-08-04 12:35 | SELL | 0.02 | 4046.48 | 4081.65 | −351.7 | −$70.46 | SL hit |
| 2026-08-05 12:56 | SELL | 0.02 | 4154.15 | 4189.41 | −352.6 | −$70.64 | SL hit |
| 2026-08-05 17:12 | SELL | 0.01 | 4233.79 | 4468.41 | −2346.2 | −$231.90 | Other (no SL) |
| 2026-08-07 09:11 | SELL | 0.01 | 4287.63 | 4468.01 | −1803.8 | −$178.44 | Other (no SL) |
| 2026-08-07 19:55 | SELL | 0.02 | 4331.85 | 4366.87 | −350.2 | −$69.76 | SL hit |
| 2026-08-11 03:28 | SELL | 0.01 | 4413.37 | 4468.00 | −546.3 | −$53.09 | Other (no SL) |
| 2026-08-11 21:10 | SELL | 0.02 | 4360.96 | 4396.10 | −351.4 | −$69.99 | SL hit |
| 2026-08-12 12:23 | BUY | 0.02 | 4418.08 | 4383.08 | −350.0 | −$70.12 | SL hit |
| 2026-08-13 01:27 | SELL | 0.03 | 4398.52 | 4433.66 | −351.4 | −$105.60 | SL hit |
| 2026-08-13 13:27 | BUY | 0.03 | 4387.53 | 4351.78 | −357.5 | −$107.43 | Other |
| 2026-08-19 21:27 | SELL | 0.02 | 4476.42 | 4511.49 | −350.7 | −$70.26 | SL hit |
| 2026-08-20 04:01 | SELL | 0.02 | 4502.78 | 4538.84 | −360.6 | −$72.24 | Other |
| 2026-08-20 14:47 | BUY | 0.01 | 4468.41 | 4233.79 | −2346.2 | −$0.06 | Other (no SL) |
| 2026-08-20 14:48 | BUY | 0.01 | 4468.01 | 4287.63 | −1803.8 | −$0.06 | Other (no SL) |
| 2026-08-20 14:48 | BUY | 0.01 | 4468.00 | 4413.37 | −546.3 | −$0.06 | Other (no SL) |
| 2026-08-24 03:26 | SELL | 0.06 | 4601.22 | 4636.54 | −353.2 | −$212.28 | SL hit |
Only 18 trades were ever booked as losses — every one shown above — out of 1,730. That is not because the strategy was rarely wrong; it is because losing trades were held open instead of closed. The full 1,730-row export is available on request.
What you would be taking on
🛑 The full risk picture
- No stop loss on 98% of positions. Losing trades were not cut; they were held open, sometimes for over two weeks.
- Basket accumulation up to 1,699 open positions. Total exposure grows as the market moves against the straddle — the opposite of risk reduction.
- Huge hidden floating drawdown. The closed drawdown of −$749.76 is not the real risk. The unrealised loss carried on the open basket is, and it is invisible in this or any closed-trade record.
- All-or-nothing profit timing. Almost the entire net came from one mass exit. If the market had kept moving against the basket instead, that same structure produces the opposite outcome.
- Live vs demo gap. The original vendor’s buyers report it working on demo but losing on live, and its public live signals were removed. Its marketplace rating is 2.33/5.
- Not for prop, not advised for live. Our read: unsuitable for funded or prop accounts, and high-risk for any live capital. CFD trading carries substantial risk and there is no guaranteed profit.
Straight answers
What is a straddle grid, in plain terms?
If it made a big net profit, why retire it?
Could I still make money with it?
Is it safe for a prop firm or funded account?
Did Trading Kernel build this?
Is it still in the Starter Pack?
Straddle AI — retired
Removed from the Starter Pack after live review. We publish the ones that don’t make the cut with the same detail as the ones that do — that’s the whole point of the Kernel Rating.
Risk disclosure
Trading foreign exchange, CFDs and other leveraged products — including gold (XAUUSD) — carries a high level of risk and may not be suitable for all investors. Grid and hedging strategies without hard stop losses can carry large unrealised (floating) drawdown that is not reflected in closed-trade results and can lead to the total loss of an account. Past performance, including the tracked live results shown on this page, is not indicative of future results; the figures here relate to one specific account, broker and configuration over a limited window, are computed from a real closed-trade export, and are shown as-is including their limitations. Nothing here is investment advice or a solicitation. You are solely responsible for your trading decisions and for complying with the rules of any broker or prop firm you use. CFTC Rule 4.41: hypothetical or simulated performance results have certain limitations and, unlike an actual performance record, do not represent actual trading.
No comments yet — be the first to share your experience.
You must be logged in to post a review.




Reviews
Clear filtersThere are no reviews yet.