Twilight Hammer Strategy


The Twilight Hammer Strategy is a pattern trading strategy tailored for the ETHUSD Forex pair on a 1-hour timeframe. Designed to exploit specific market patterns, this strategy was backtested over a two-year period, from 2023-01-01 to 2024-12-01, to evaluate its effectiveness. With a probability greater than 60% for bullish candles following its defined conditions, this strategy aims to provide consistent returns in a volatile market.
Strategy Overview
Strategy Name: Twilight Hammer Strategy
Strategy Type: Pattern Trading
Instrument: Forex – ETHUSD
Timeframe: 1 Hour
Back test Period: 2023-01-01 to 2024-12-01
Strategy Conditions
The Twilight Hammer Strategy is built on four key conditions:
- Bearish Candle Formation:
- The candle’s open price must be higher than its close price.
- Body Length Dominance:
- The body length (difference between open and close) must exceed A% of the total wick length.
- Upper Wick Dominance:
- The lower wick must be less than B% of the upper wick.
- Strategic Time Windows:
- The strategy is applicable only during specific trading hours:
[C, D, E, F, G, H, I]
- The strategy is applicable only during specific trading hours:
Note: Condition 4 is not a primary condition, meaning it is not required for the pattern probability, it was just added as an optimization parameter to improve the overall performance
These conditions were meticulously designed to capture high-probability bullish reversals.
Backtesting Results
Strategy Performance Analysis
| Metric | Value |
|---|---|
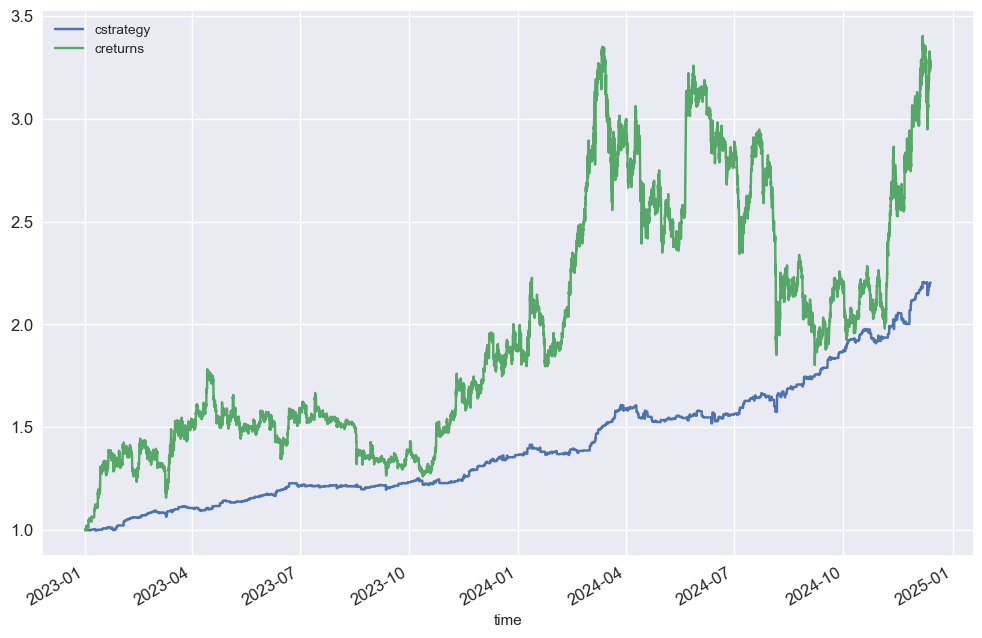
| Cumulative Returns | 3.26 |
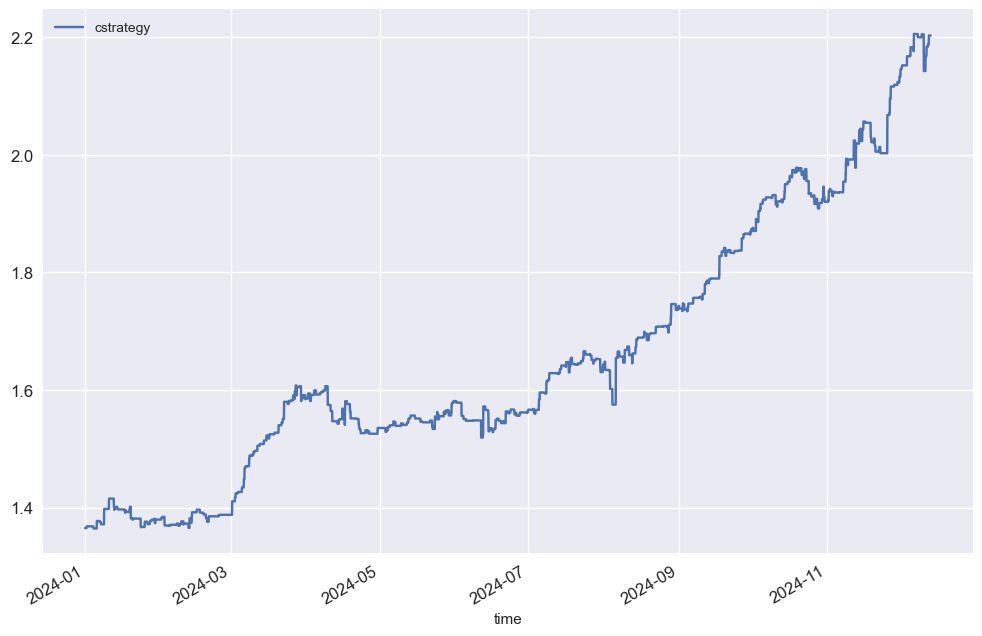
| Cumulative Strategy | 2.20 |
| Out/Under Performance | -1.06 |
The strategy generated positive cumulative returns over the backtest period, though it underperformed compared to the benchmark returns by 1.06 points.
Overall Performance Metrics
| Metric | Value |
|---|---|
| Compound Annual Growth Rate (CAGR) | 49.95% |
| Annualized Mean | 40.52% |
| Annualized Std Dev | 11.88% |
| Sharpe Ratio | 4.21 |
| Sortino Ratio | 5.69 |
| Maximum Drawdown | 5.52% |
| Calmar Ratio | 9.05 |
| Max Drawdown Duration | 102 hours |
| Kelly Criterion | 29.03 |
The high Sharpe and Sortino Ratios reflect excellent risk-adjusted returns, while a maximum drawdown of 5.52% ensures relatively low capital risk.
Risk Management
- Define Risk: Analyze the historical maximum drawdown (5% – Non Leveraged!!) to configure an appropriate lot size.
- Position Sizing: Use the Kelly Criterion for optimal allocation (29.03 of capital).
Backtesting and Optimization
- Frameworks: Backtesting was conducted using the Shreya Framework on MT5 and DxTrade platforms.
- Optimization: Parameters such as A and B can be Optimized, but note that minimum optimization should be carried out as such to avoid overfitting
Strategy Resource Files
TradingKernel.com provides all necessary resources for seamless implementation:
- Python File (.py): Automates the strategy on the Shreya Framework.
- MT5 Indicator: Ready-to-use indicator for MetaTrader 5.
- Financial Analysis: Detailed Jupyter Notebook report for further insights.
👉 Download the Strategy Files Here for in-depth performance analysis, insights, and implementation details.

