


Blazzers Beast 2.0 Pro for MT4 and MT5
Elevate your forex trading with Blazzers Beast 2.0 PRO, a high-frequency scalping EA from Trading Kernel This powerful EA can potentially flip accounts by leveraging advanced pinbar detection, candlestick analysis, and indicators like WPR and AO. Designed for speed and precision, it executes rapid trades to capture small price movements, offering customizable lot sizes, trailing stops, and stop-loss/take-profit settings. Its news filter avoids volatile market events, ensuring safer trades, while the user-friendly dashboard displays real-time trade data. Perfect for beginners and pros, Blazzers Beast 2.0 PRO supports ECN brokers and up to five orders for maximum profitability. Get it now at tradingkernel.com

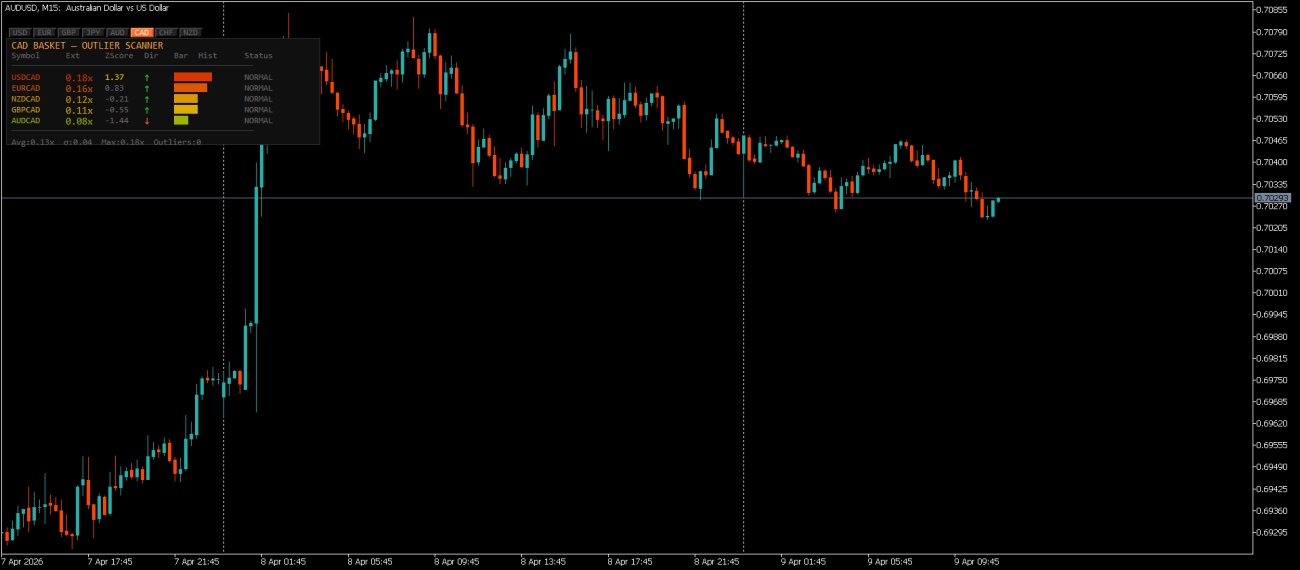
Dynamic Outlier Quotes Reversal Indicator for MT5
Dynamic Outlier Quotes Reversal Indicator Specifications
-
Platform: MetaTrader 5 (MT5)
-
Product Type: Mean Reversion / Reversal Indicator
-
Current Version: 1.01
-
Programming Language: MQL5
-
Developer: Trading Kernel
-
Supported Assets: Forex, XAUUSD (Gold), Indices, and Crypto
-
Core Logic: Statistical Outlier Detection & Volatility Analysis
-
Visuals: Dynamic Bands, Dashboard HUD, and Reversal Labels
-
Delivery Format: Instant Download (.ex5 or .mq5)

Gold Fury MT5
Product Specifications
-
Platform: MetaTrader 5 (MT5)
- Launch Price : $299, Final Price : $1499 (Once MyFxbook reaches 150%)
-
Product Type: Fully Automated Expert Advisor (EA)
-
Symbol: XAUUSD (Gold)
- Timeframe: (5 - 15)Min
-
Current Version: 1.00
-
Programming Language: MQL5
-
Developer: Trading Kernel
-
Backtest Period: 2023 - Present
-
Risk Settings: Constant Lot or % Risk Per Trade
-
Delivery Format: Instant Download (.ex5)

Starter Pack For Algo Traders
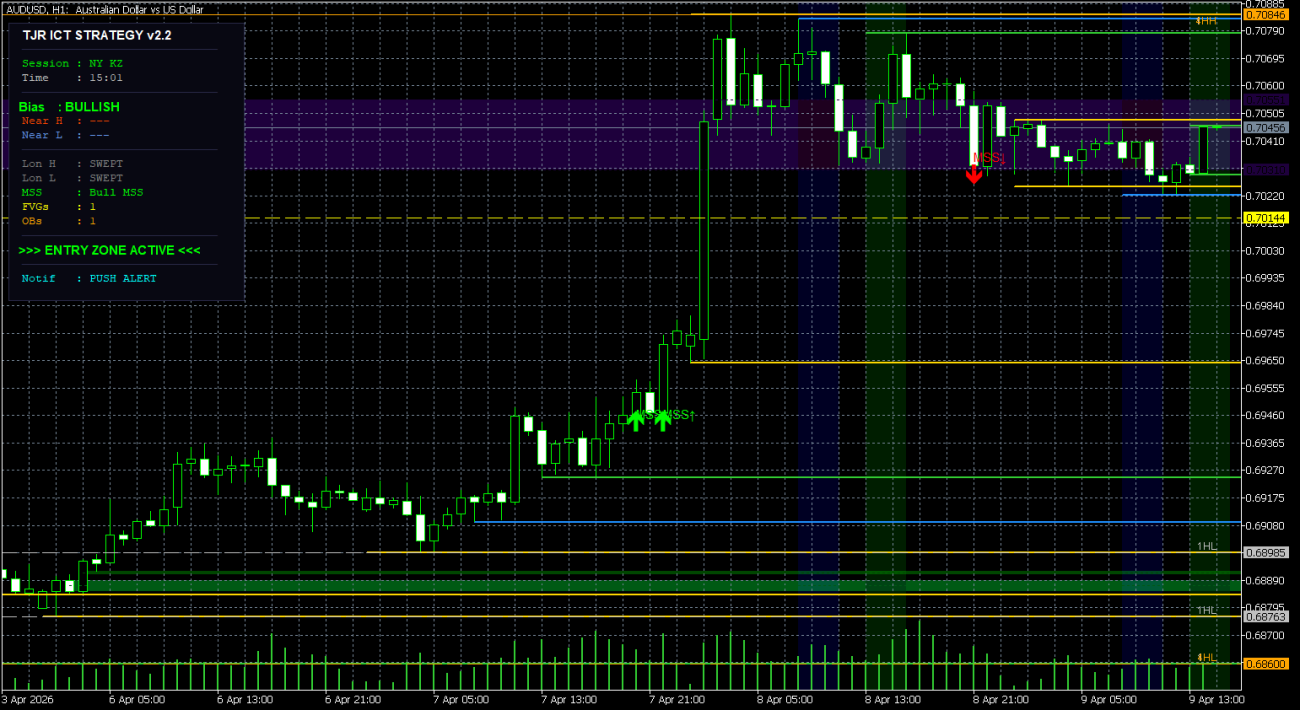
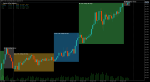
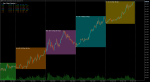
TJR ICT Concepts Indicator for MT4 & MT5
TJR ICT Concepts Indicator Specifications
-
Platforms: MetaTrader 4 (MT4) & MetaTrader 5 (MT5)
-
Methodology: ICT / Smart Money Concepts (SMC)
-
Key Signals: MSS (Market Structure Shift), BOS (Break of Structure), Session Highs/Lows
-
Visualization: Multi-session color coding, Dynamic Labels, HUD Dashboard
-
Timeframes: Compatible with M1 to Monthly (Optimized for Intraday)
-
Alerts: On-screen, Sound, and Push Notifications for structure shifts
-
Delivery: Instant Download via Trading Kernel
Reviews
Clear filtersThere are no reviews yet.