


Range Liquidity
Every range edge is a pool of resting orders. See which ones are still waiting, which were just raided, and which are gone, on any symbol, in New York time.
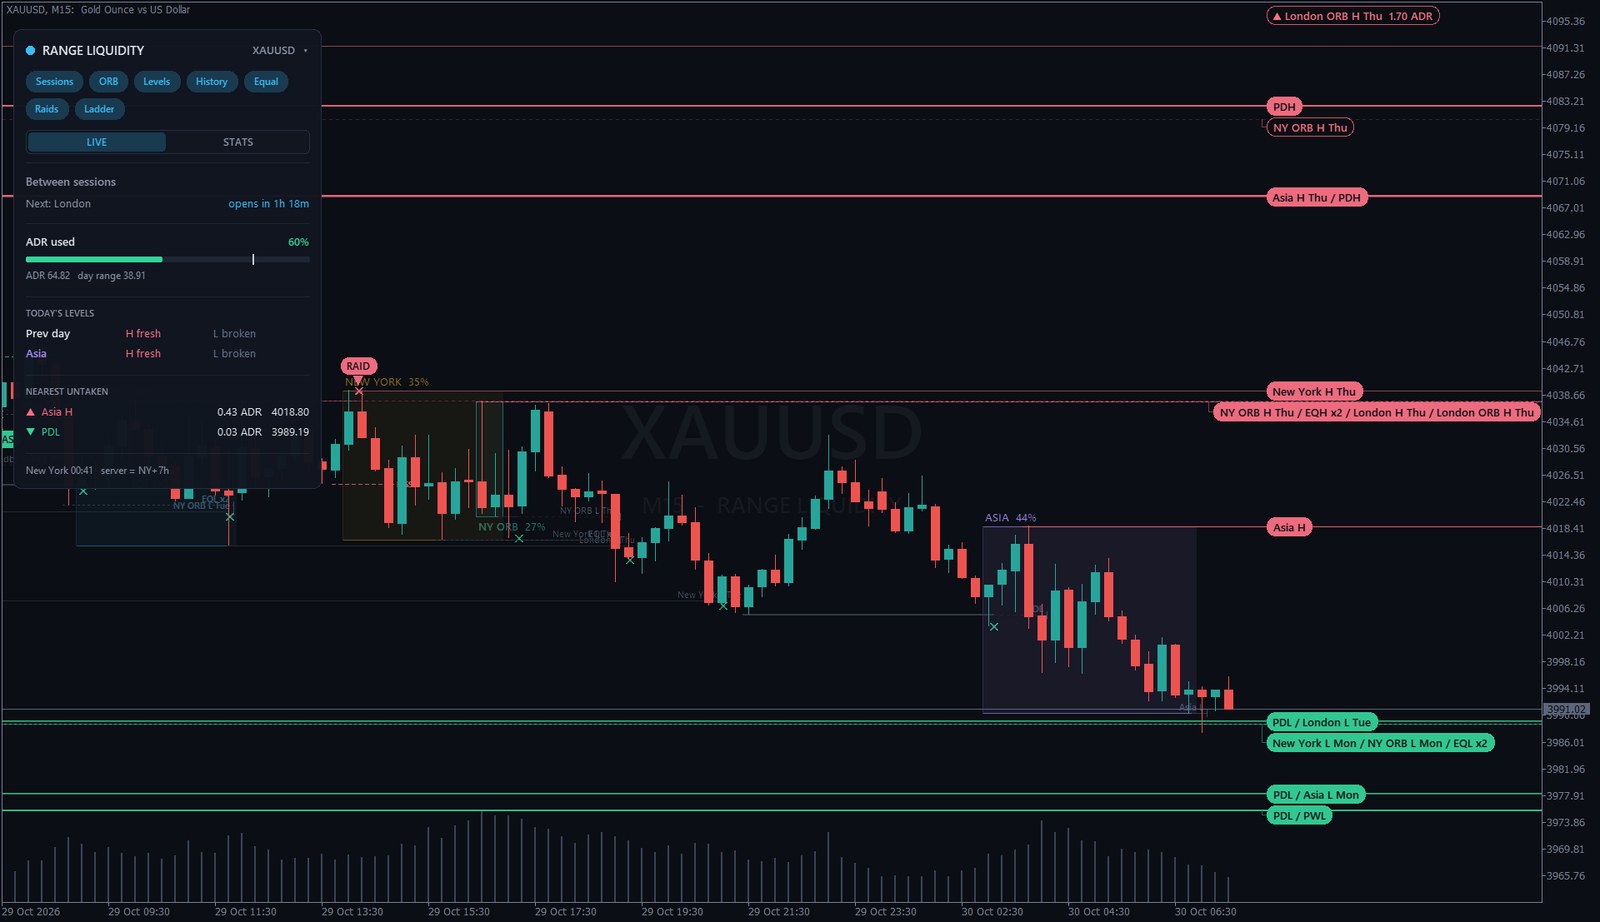
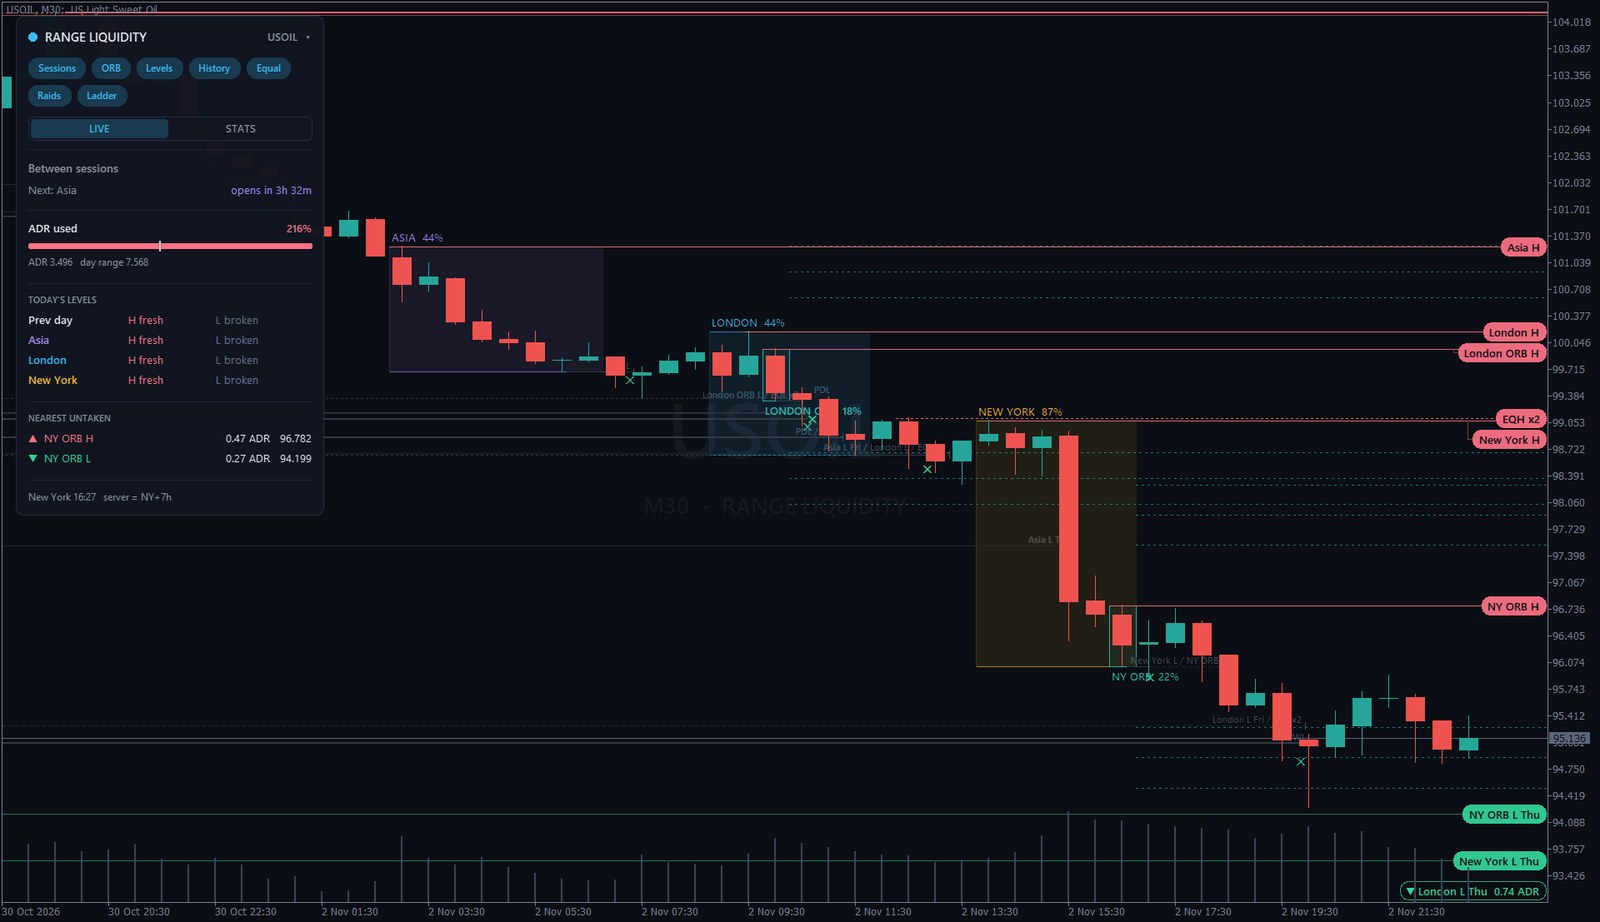
Liquidity sits at the edges
Beyond every obvious high and low there are stop losses, breakout orders and liquidations. Price is drawn to them. Range Liquidity draws the ranges traders actually watch and follows each edge from the moment it forms. Every edge ends up in one of three states:
The ranges that matter, nothing else
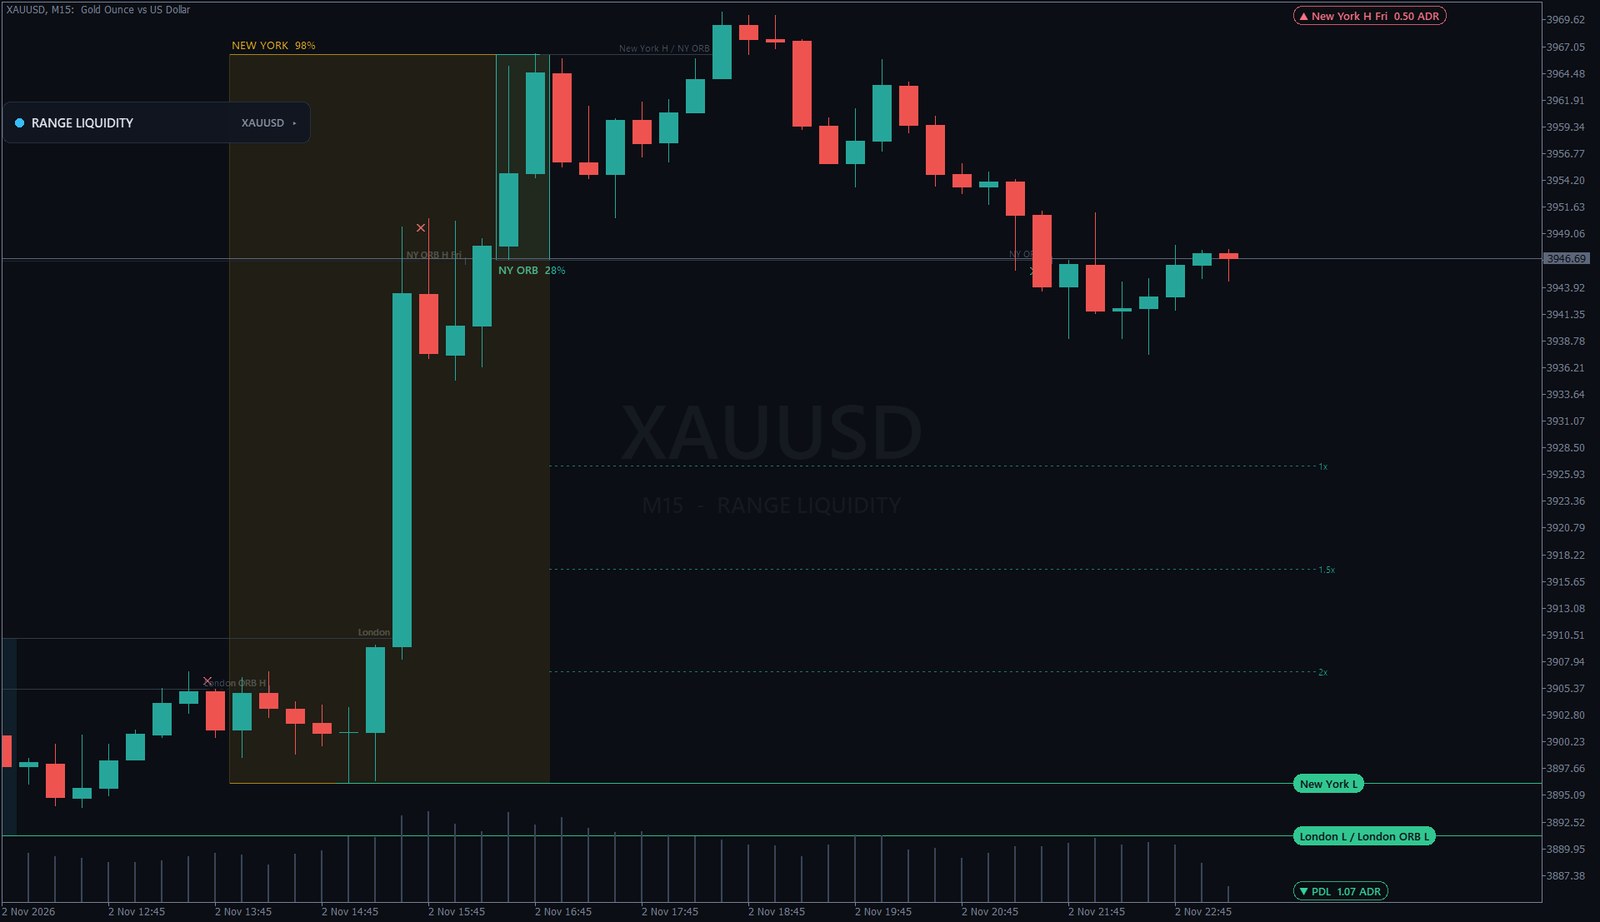
Asia, London, New York
Defined in New York time and corrected for daylight saving on every bar of history, whatever your broker's clock. Each box shows its range as a share of the daily average.
Day, week, month
Previous day, week and month highs and lows, drawn heavier because more orders rest there.
Opening ranges
London and New York opening ranges with 1x / 1.5x / 2x projections. Length and projections are your choice.
Equal highs & lows
Built from real swing points, not bars that happen to match, and closed the moment price trades through them.
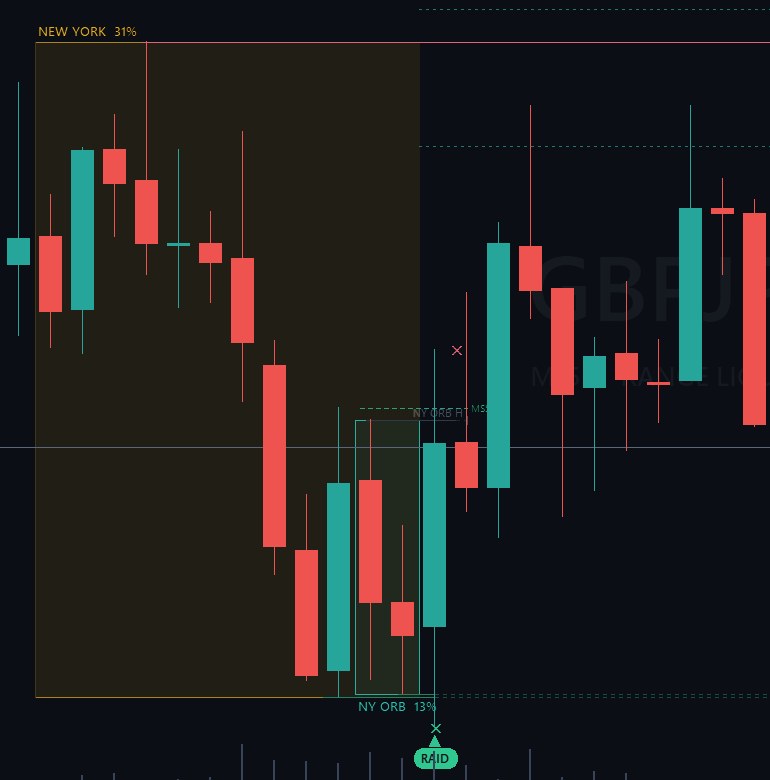
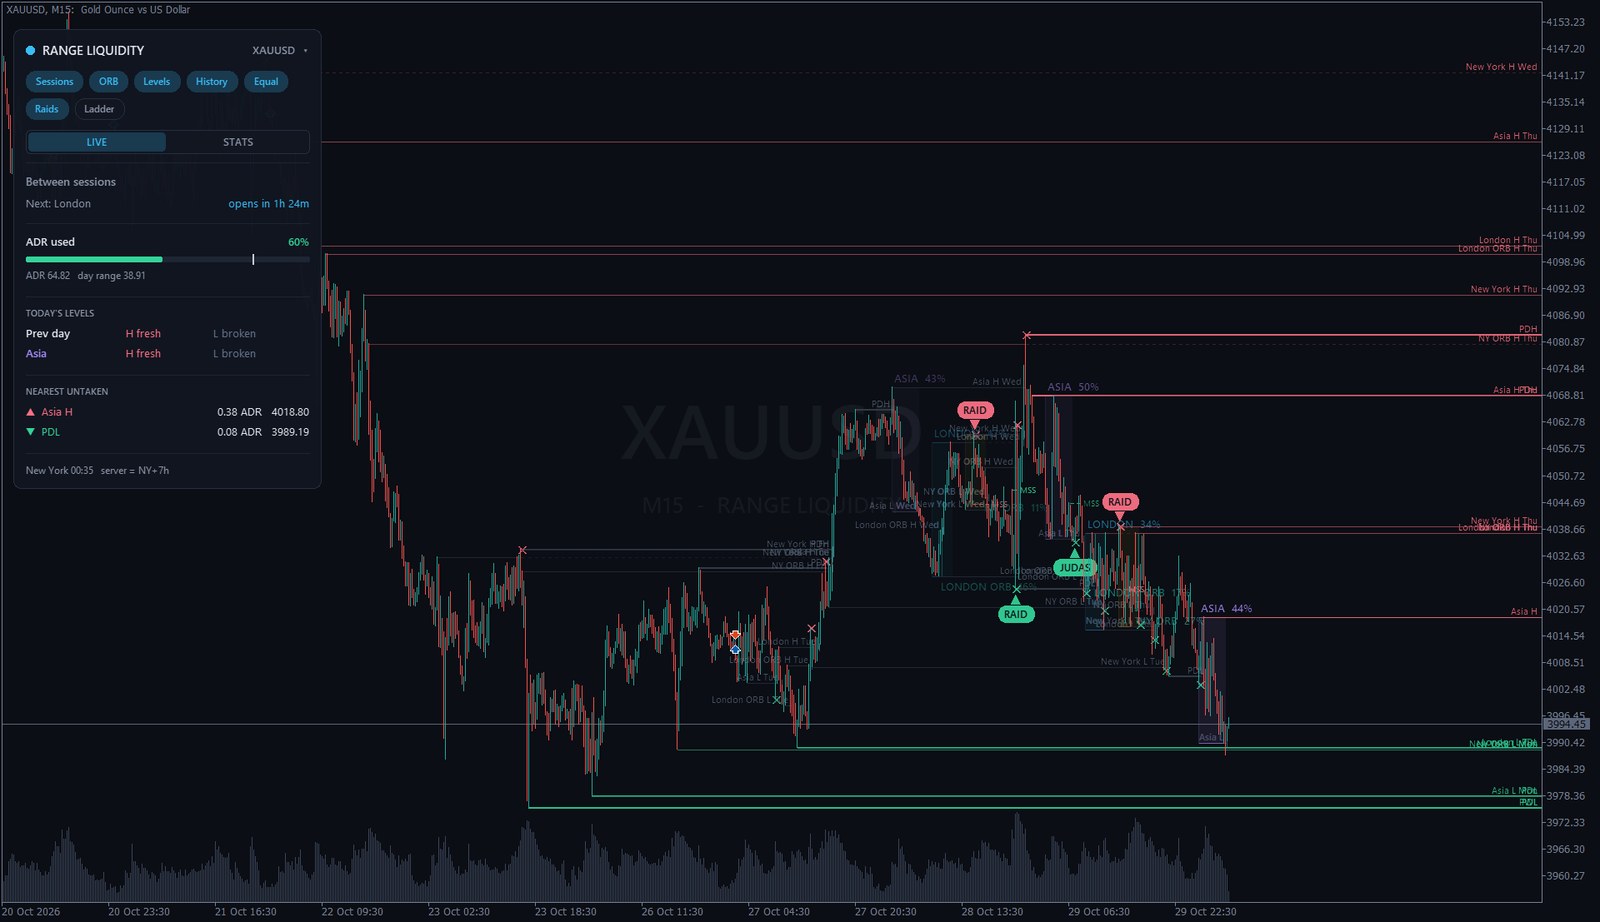
Raid reversals & Judas
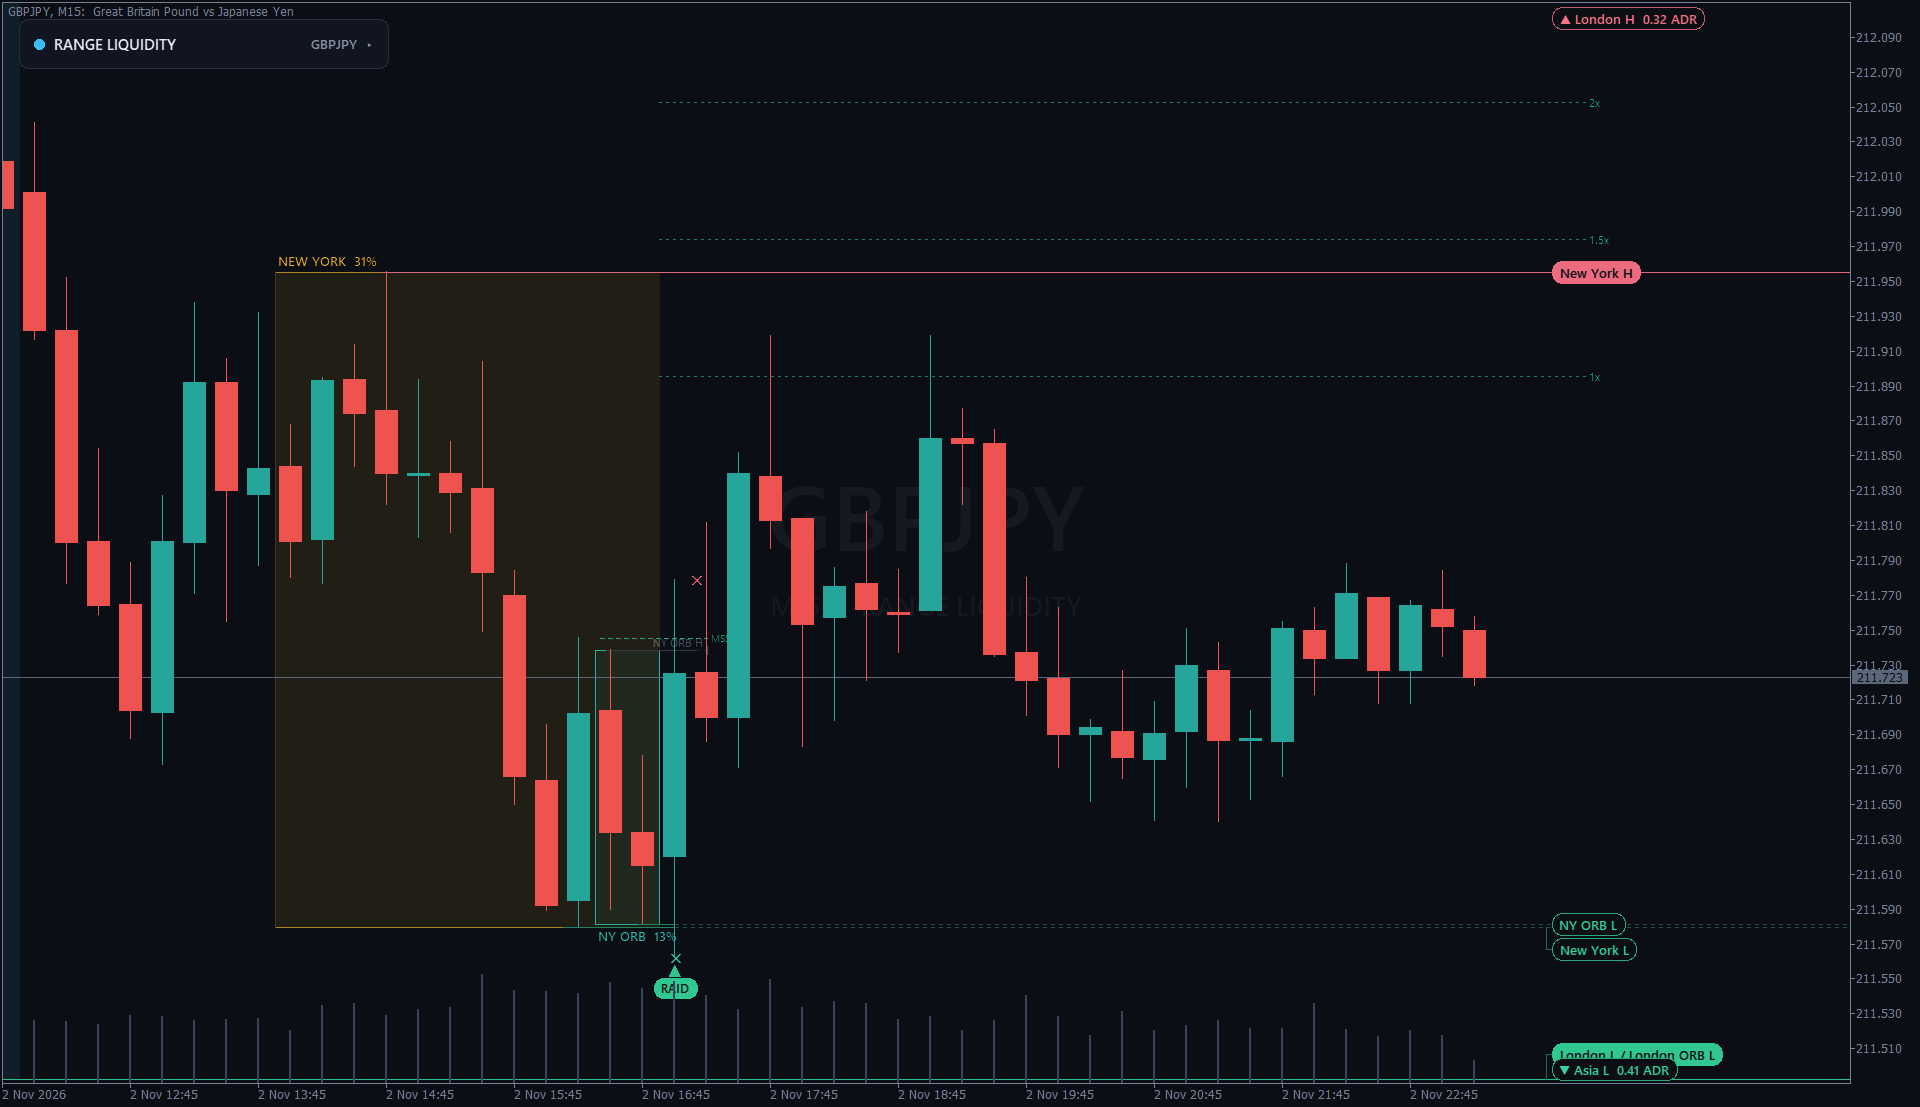
A sweep followed by a structure shift the other way, marked where the raid happened. On the Asia range it is labelled the Judas swing.
Right-edge ladder
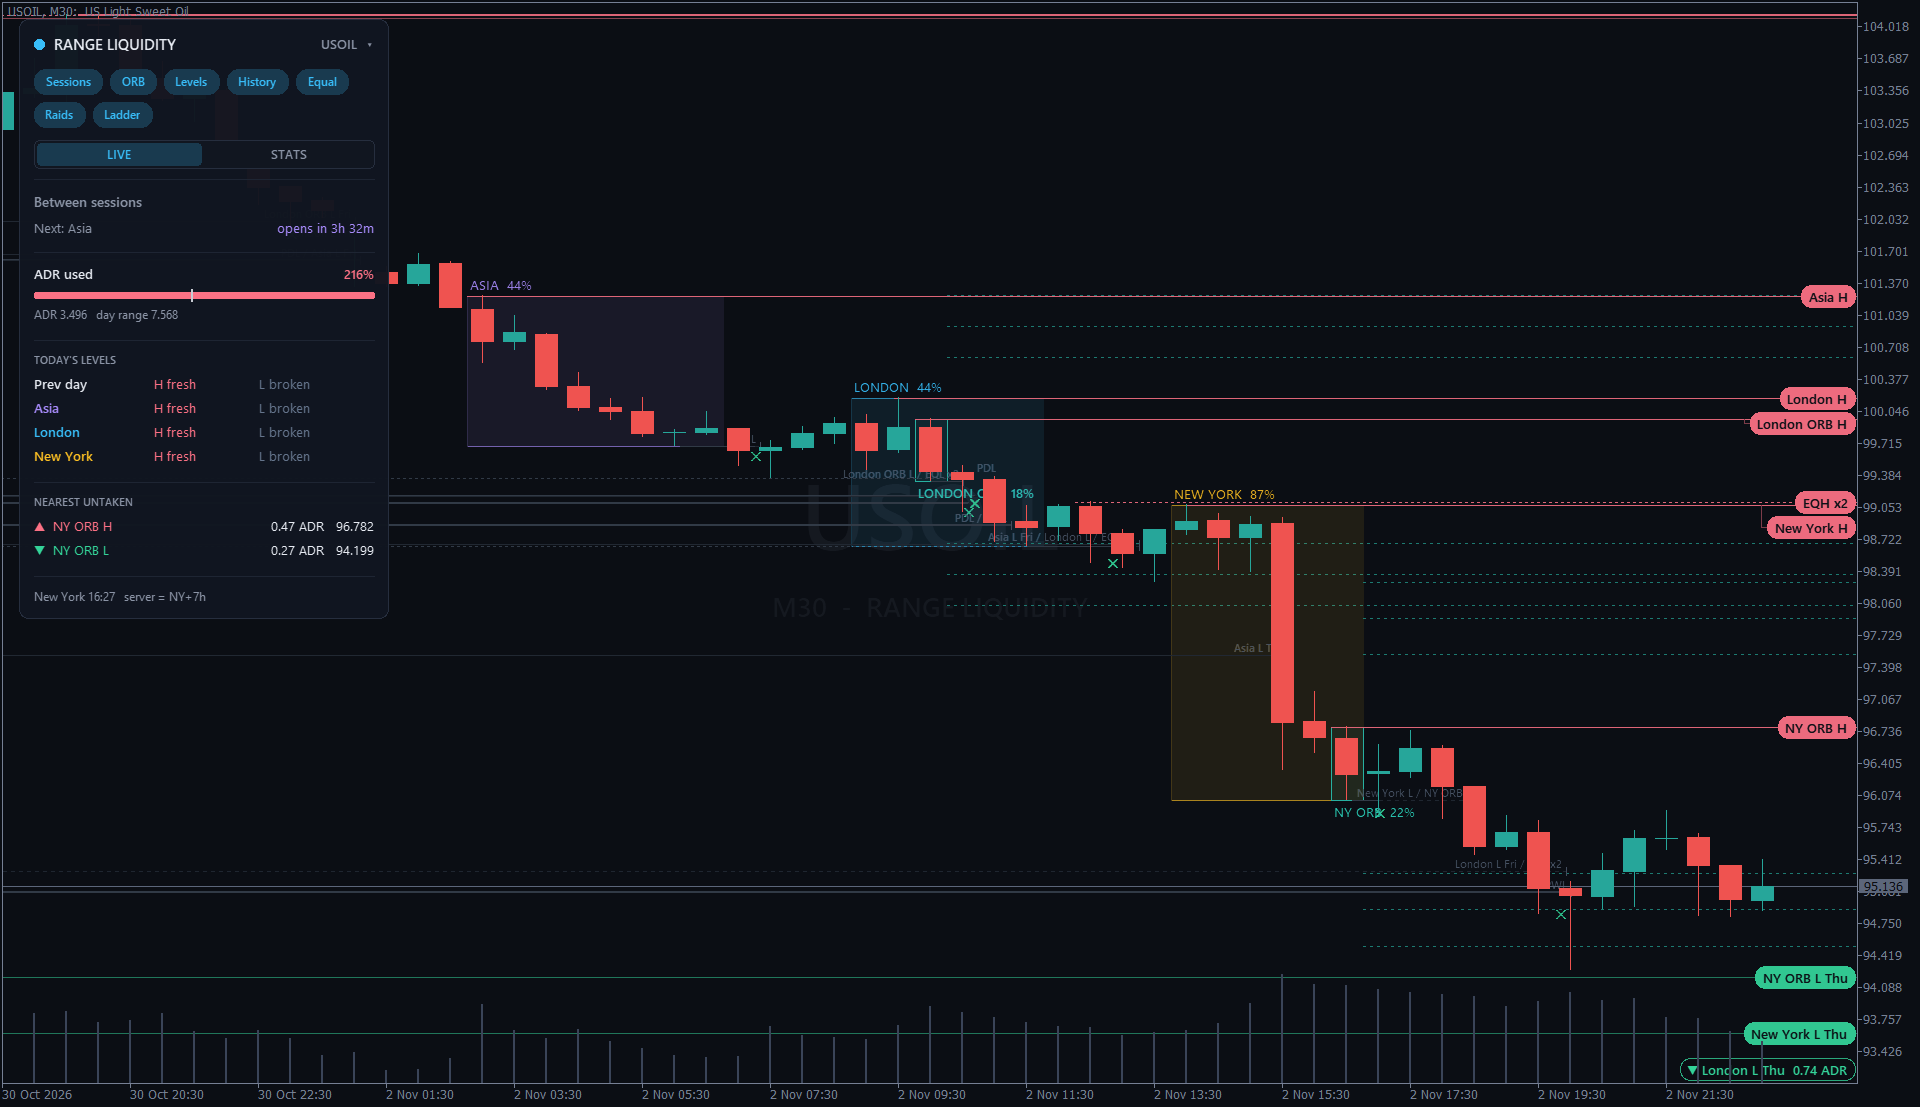
The nearest untaken levels above and below price as clean pills that never overlap, plus the next level off-screen with its distance in ADR.
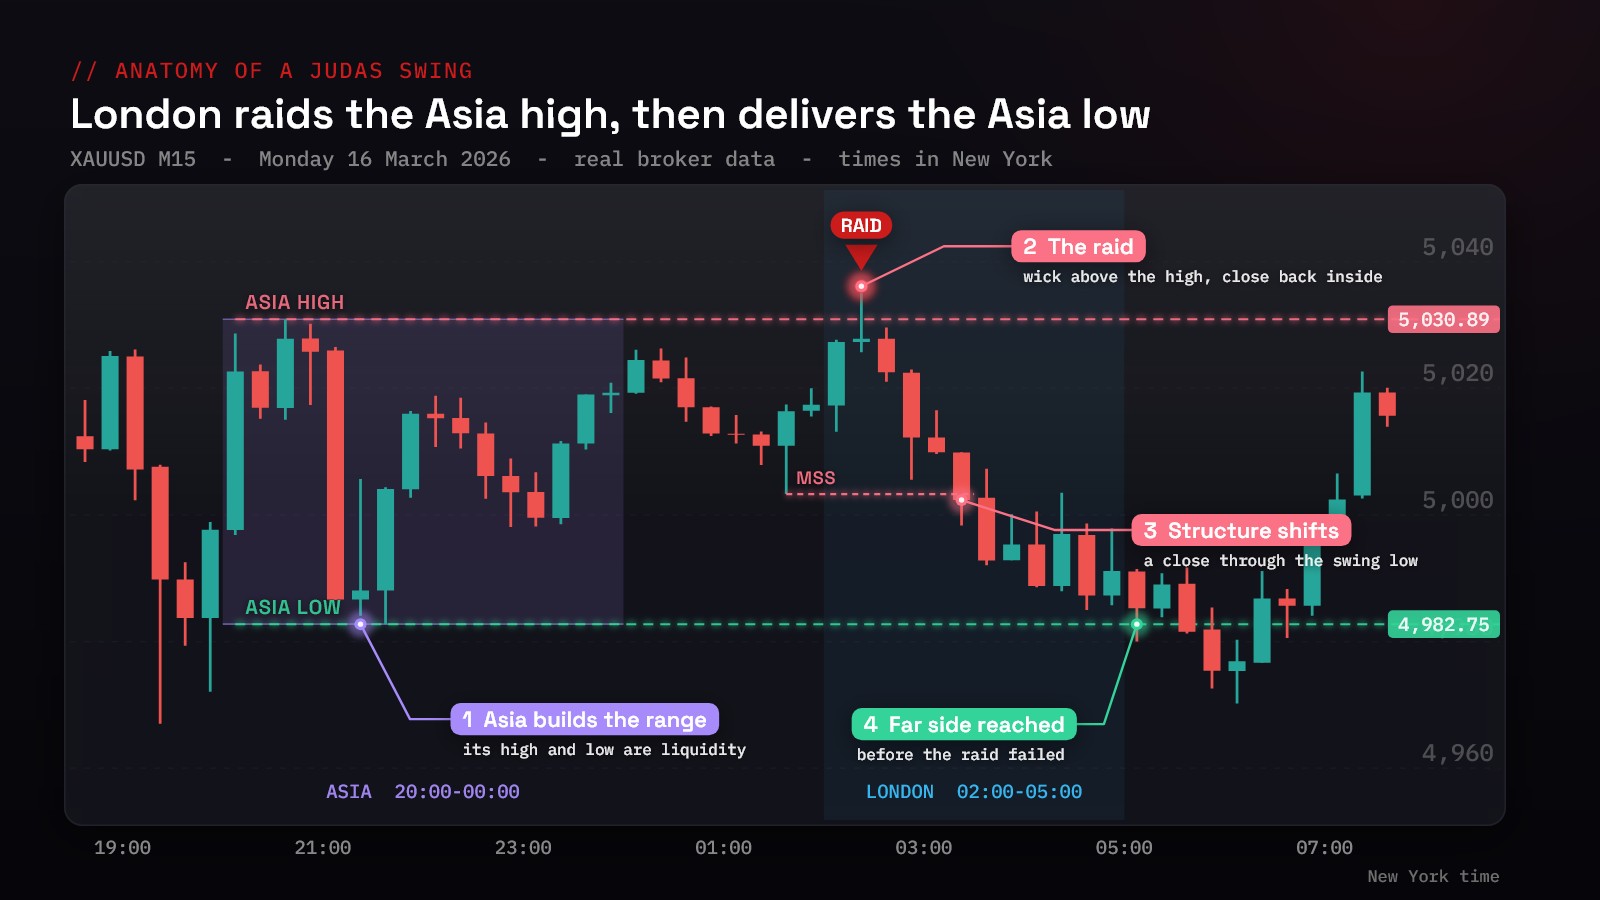
Anatomy of a Judas swing
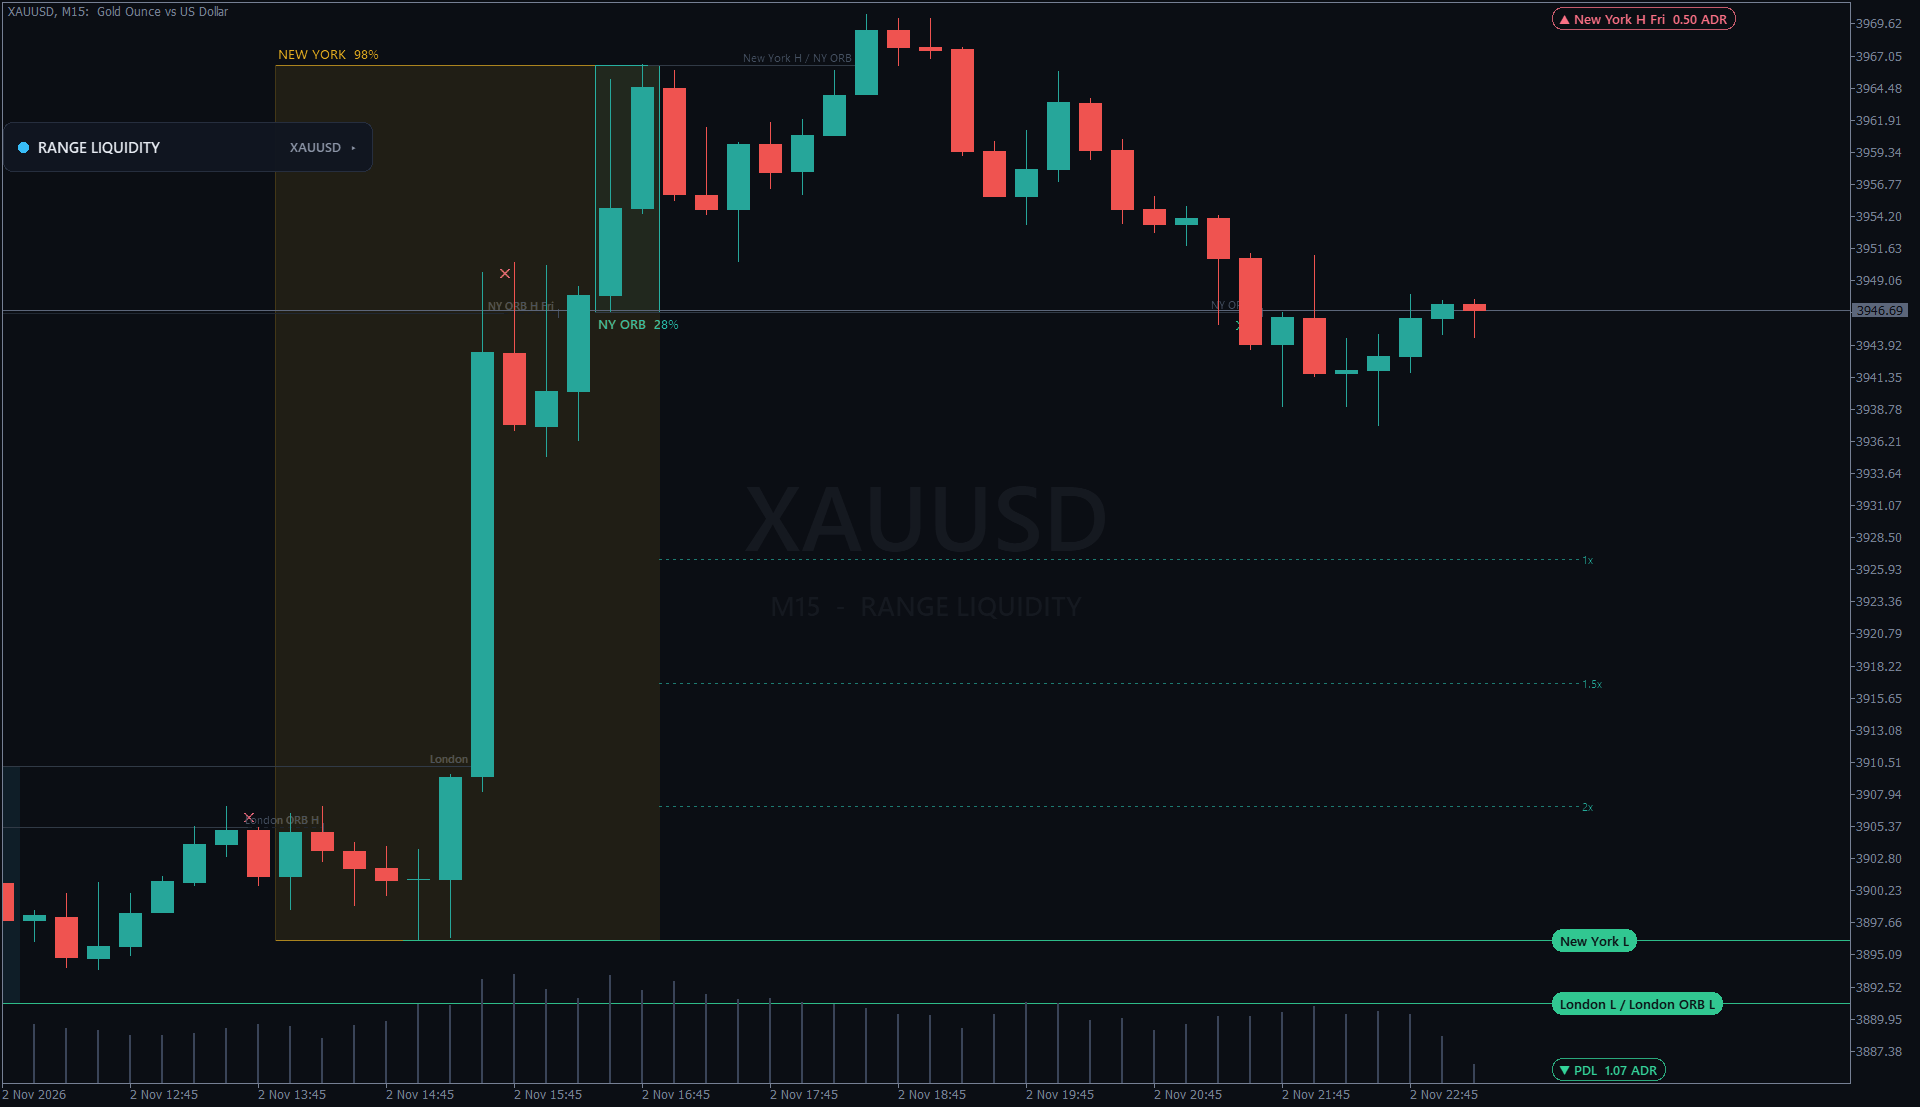
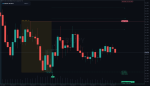
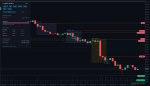
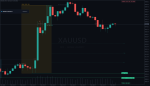
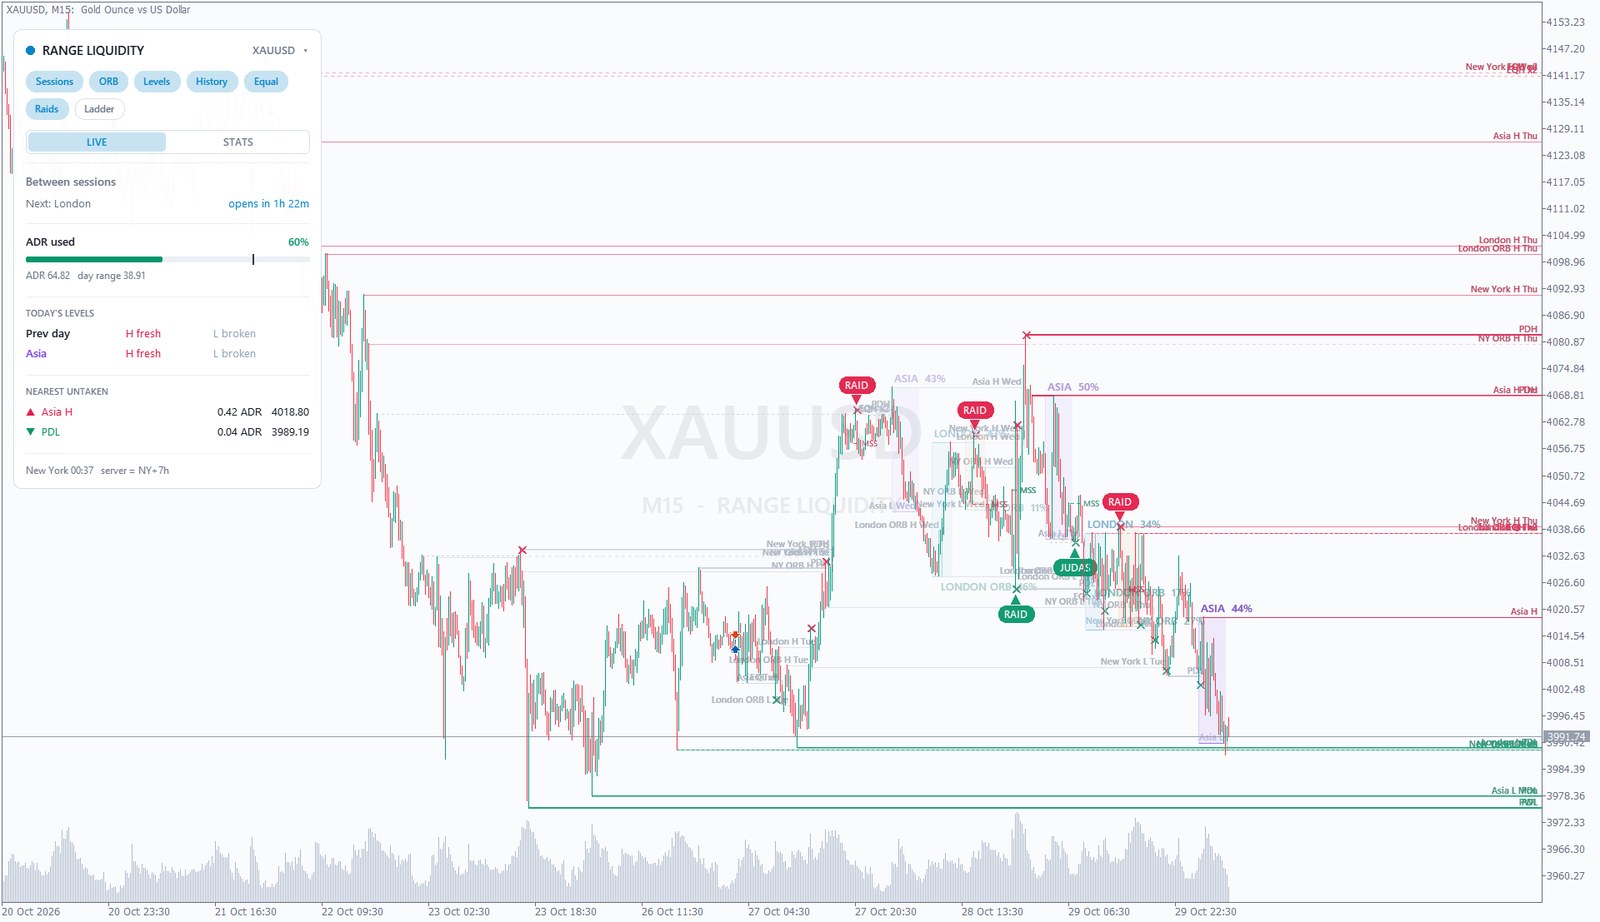
Range Liquidity marks a raid when price sweeps a range edge and then breaks structure the other way. On the Asia range this is the classic Judas swing. Below is a real one on gold, found with the indicator's own rules and drawn step by step.
Answers before you ask
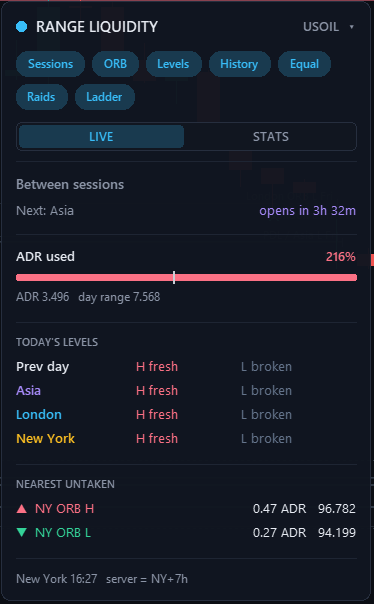
A compact panel that answers the questions you would otherwise work out by hand every morning.
- Which session is live, how long it has left, and how big it already is compared with the same session's own average.
- Has London taken Asia yet? The high and low of the previous day and of each session today, each marked fresh, swept or broken.
- How much of the day is spent: ADR used, turning amber at 70% and red at 100%.
- Where the next liquidity is: the nearest untaken level above and below price, with its distance.
- Seven one-click layers (sessions, ORB, levels, history, equal levels, raids, ladder) remembered for each symbol.
- Drag it anywhere by its header. It remembers where you put it and collapses to a single line with one click.
Your symbol’s history, with the working shown
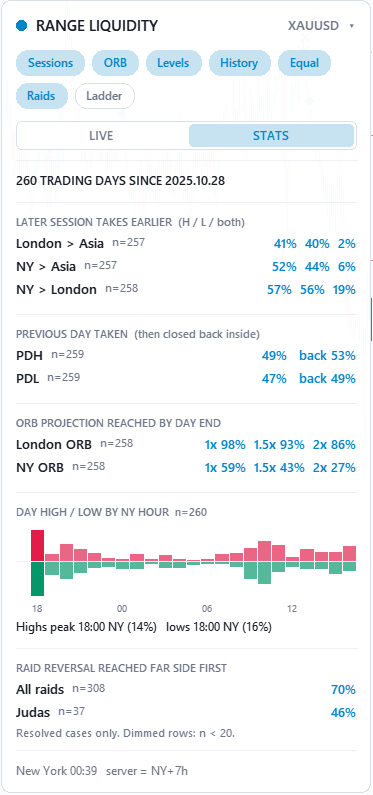
The STATS tab measures how your symbol on your broker has behaved around these ranges over the last year: how often a later session takes an earlier one's high or low, how often the previous day's high or low is taken and then closed back, which opening-range projections get reached, which New York hour usually prints the day's high and low, and how often a raid reversal reached the far side of its range.
- Every number shows its sample size. Rows with fewer than 20 cases are dimmed, because a percentage from a handful of cases means very little.
- Only finished cases count. Today waits until it is over. A raid that has neither worked nor failed is left out, not counted as a win.
- Ties go against the setup. If the target and the failure happen in the same candle, it counts as a failure.
- Same definitions as the chart. The statistics run the same engine as the levels you see, so a sweep in the numbers is exactly a sweep on the chart.
Beautiful in the dark and in the light
One switch restyles the whole chart: background, candles, wicks, axis, price lines and grid. Everything else is drawn on one translucent layer behind the candles, so a box never hides a candle. Your own chart colours are saved first and come back the moment you remove the indicator.
Told once, exactly once
Get an alert when a level is swept, when it breaks, or when a raid reversal or Judas swing confirms. Choose which levels count (day/week/month, sessions, opening ranges, equal levels) and how you hear about it: popup, sound, push notification or email. Each event is announced once. Recalculating never repeats an alert, and attaching the indicator never replays old events.
Rebuilt from the ground up
- Sessions moved from raw server hours to New York time with automatic daylight saving. In v2 the killzones were wrong on most brokers and an hour out twice a year.
- Levels now show what happened to them instead of running on forever.
- A translucent canvas behind the candles replaces filled boxes that covered them.
- New: ladder, live panel, statistics, raid reversals, alerts, dark and light styling, six presets.
- Gone: the version expiry date and the forced white chart. Order blocks and FVGs moved out; ranges are this indicator's job.
The details
| Platform | MetaTrader 5 and MetaTrader 4 (both included) |
| Symbols | Any: forex, gold, indices, crypto, commodities |
| Timeframes | Any. Detection reads M5 data, so levels are identical on every timeframe (M1 and M15 selectable) |
| Broker clock | Detected automatically; US, EU or no-DST server clocks supported |
| Presets | Default, Full Sessions, Clean Levels, Indices Open, Scalper, Light |
| Trading | None. It is an indicator and never touches your trades |
Straight answers
Does it repaint?
Completed ranges, sweeps and breaks are decided on closed candles and do not change afterwards. Two things are live by nature and are labelled as such: a session still forming (its box says LIVE and grows) and today's figures. A raid reversal appears once its structure shift has closed, and is drawn on the candle where the raid happened.
Will the sessions be right on my broker?
Sessions are set in New York time and converted for every bar with the correct daylight-saving rules. The panel shows New York time and your server's offset, so you can check it at a glance. Brokers whose clocks follow European daylight saving or none at all are one setting away.
Is it a signal service?
No. It shows where liquidity sits, what price has done to it and how your symbol has behaved around it in the past. What you trade is your decision.
Will it change my chart colours?
Only if chart styling is on (the default), and only while the indicator is on the chart. Your colours are restored when you remove it. Switch styling off and the indicator fits whatever theme you already use.
Know where the orders are
Every range, every edge and every raid, in New York time, on a chart you will enjoy looking at.
Trading involves substantial risk of loss. Range Liquidity provides information, not advice or trading signals. Statistics describe the past on the user's own data and do not guarantee future market behaviour.
No comments yet — be the first to share your experience.
2 reviews for Range Liquidity Indicator for MT5
Clear filtersYou must be logged in to post a review.

Sarah –
As an SMC Trader, I’m blown away by this indicator. The ability to plot 7 days of session ranges with customizable colors (love the Honeydew for Asian!) makes it easy to spot support/resistance. The setup was a breeze on MT5, and the support team via WhatsApp was super helpful. 5 stars all the way!
Alex –
This indicator nails breakout trading with its liquidity voids and order block visualization. Easy to backtest too!