


Every scanner finds you an 80%.
This one tells you if it's real.
Period Visualizer Pro sweeps your whole watchlist for the days, sessions and months that keep closing in the same direction — then scores every hit for statistical confidence, so you can tell a genuine edge from twenty lucky coin flips. Click any row and the chart opens with that period's range drawn on it.
Wilson 95% lower bound — the same function that runs inside the indicator. Drag the sample down to 10 and watch 80% stop meaning anything.
80% of what, exactly?
Every period scanner on the market will happily tell you that gold closes up on Tuesdays 80% of the time. Almost none will tell you that the number came from ten Tuesdays — a sample so small that pure chance produces it regularly.
80% from 10 samples scores 49% confidence. 80% from 100 samples scores 71%. Same headline number, completely different trade. Period Visualizer Pro shows you both figures side by side and counts how many of your hits chance alone would have produced.
One sweep, five ways to read it
The scanner
Every symbol in your watchlist, every period, ranked. Bias, probability, confidence, sample size, average range, up and down excursions, recency, range used and the last five outcomes — in one table. The footer counts your tests and tells you how many hits chance alone would produce.
The heatmap
The same sweep as a grid. Green up, red down, intensity by strength, outlined cells pass your filter. Click any cell to open that chart.
The focus chart
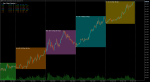
Every instance behind the number, boxed on the chart with its range labelled — plus a projection drawn from today's open using the average up and down excursion.
The proof panel
The twenty instances behind 85%, listed. Date, open, close, direction, range, up and down travel, and when the high and low actually formed. Nothing hidden behind a percentage.
The stats panel
One symbol, every period at a glance — bias, confidence, average range, sample size and recent form.
Built for people who check the maths
Wilson confidence scoring
A 95% lower bound on every row, colour-coded and sortable. 80% from 10 samples scores 49%. 80% from 100 scores 71%. Same headline, different trade.
Expected false positives
The footer counts your tests and computes how many hits chance alone would produce at your threshold. Nothing else in this category does this.
Recency split
Full-sample probability beside the newer half, so an edge that died eighteen months ago shows up as a gap instead of a good number.
Up and down excursions
Not just the range — the average travel above and below the open. That is what you size a target and a stop against.
Range-used gauge
How much of the average range the period forming right now has already spent. 27% means room left. 140% means the move is done.
Intraday clock
When the high and the low usually form, and how often the high comes first. A bullish day that dips first is a different trade.
Counted in instances
Ten means ten Mondays, ten London sessions, ten Januaries. Your chart's timeframe never changes a single number on screen.
Closed periods only
A period counts the moment its window has fully elapsed. Nothing repaints, and today's unfinished session never pollutes an average.
True session ranges
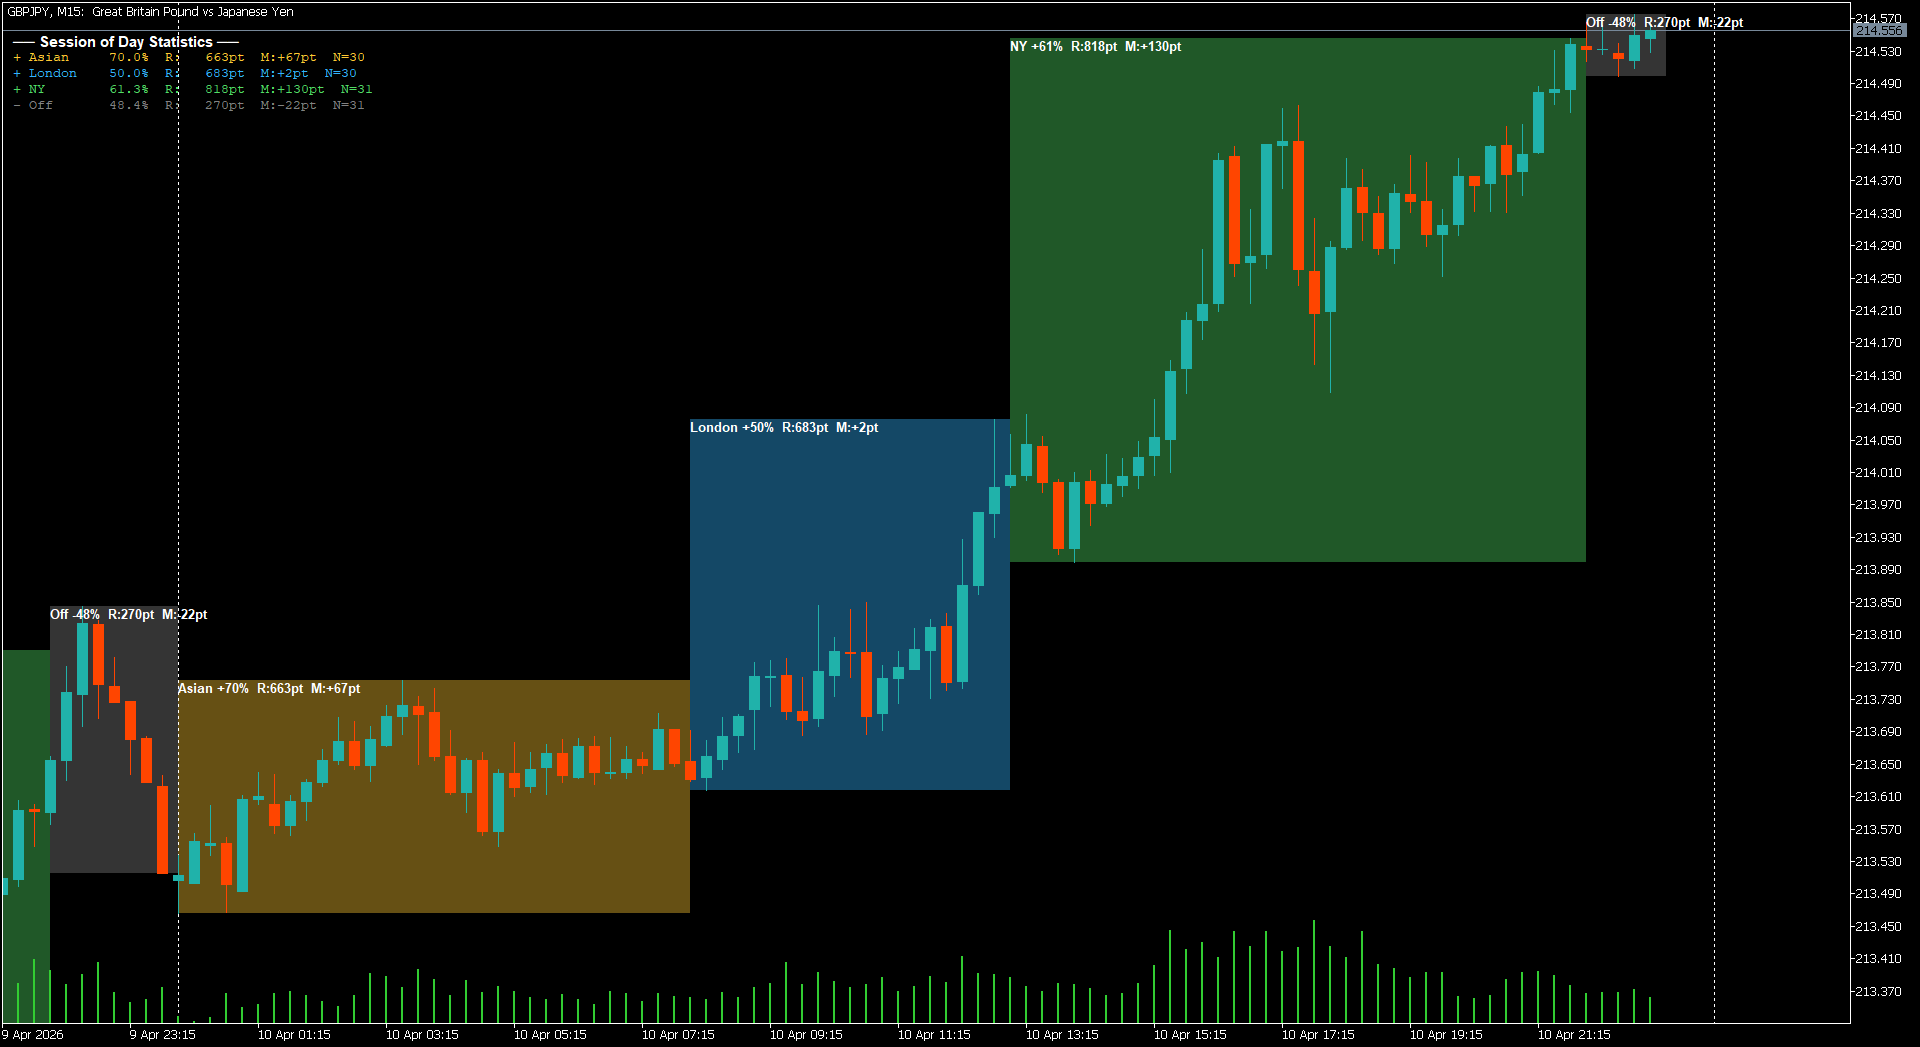
London is the full 08:00–17:00, New York the full 13:00–22:00. Overlapping hours count for both instead of truncating one.
Three preset slots
Save a whole configuration — mode, instances, threshold, symbol list, session hours — and reload it in one click.
CSV export
Every column including confidence, written to MQL5\Files, ready for Excel or your own backtest pipeline.
GMT or server hours
Enter session times however you think about them. The broker's offset is detected and displayed, so sessions are never quietly wrong.
Sweep, verify, trade
- Drop it on one chartAny symbol, any timeframe. Set your symbol list — or point it at your whole Market Watch — and the table fills in as history loads.
- Sort by confidenceIgnore the headline percentage. Sort by CONF, check the footer's expected-by-chance count, and open Data on anything that survives.
- Open the chartOne click opens that symbol with the period boxed, the excursion projection drawn from today's open, and the full breakdown available.
Reading the scanner
| Column | What it means |
|---|---|
| BIAS | The dominant direction and how often it occurred. |
| PROB | The raw hit rate — the number every other scanner shows you. |
| CONF | Wilson 95% lower bound. The pessimistic reading. Below 50% means the sample cannot separate the edge from a coin flip. |
| N | Instances analysed. Ten Mondays is ten, regardless of chart timeframe. |
| AVG RANGE | Mean high-to-low travel for that period, in points. |
| UP / DOWN | Average excursion above and below the open. Size targets and stops against these, not the range. |
| RECENT | Hit rate over the newer half of the sample. A gap against PROB means the edge is fading. |
| USED | How much of the average range the period forming now has already spent. |
| LAST 5 | The five most recent outcomes, oldest to newest. |
One licence, everything included
There is no cut-down edition and no upsell. Every buyer gets the same build, the same features, and the complete source.
The compiled indicator
PeriodVisualizerPro.ex5 — drop it on a chart and run. Every feature on this page, working out of the box.
The full MQL5 source
PeriodVisualizerPro.mq5 — around 3,000 lines, commented throughout. Read it, modify it, learn from it, or lift the statistics into your own EA.
Unlimited accounts
No per-terminal licensing, no activation limits. Run it on as many accounts and computers as you own.
Illustrated user guide
Every input explained, with worked examples for day-of-week, session and monthly modes.
Lifetime updates
Every future v2.x release, free. v2.10 is current.
Direct support
Straight from Trading Kernel — not a ticket queue. Setup help, input questions, and guidance on reading the numbers.
Licence, in plain terms. The source is yours to read, modify and run on your own accounts indefinitely, including inside your own EAs for personal use. What you cannot do is redistribute or resell it, in original or modified form.
Before you buy
Will this tell me when to enter a trade?
No, and any tool that claims to is selling you something else. Period Visualizer Pro tells you which periods have historically closed in one direction, how much of that is likely to be chance, and how far price typically travels from the open. What you do with that is your decision and your risk.
Does it repaint?
No. A period only enters the statistics once its window has fully elapsed and can no longer change. Today's unfinished session is drawn on the chart so you can see it forming, but it is excluded from every average until it closes.
What timeframe should I run it on?
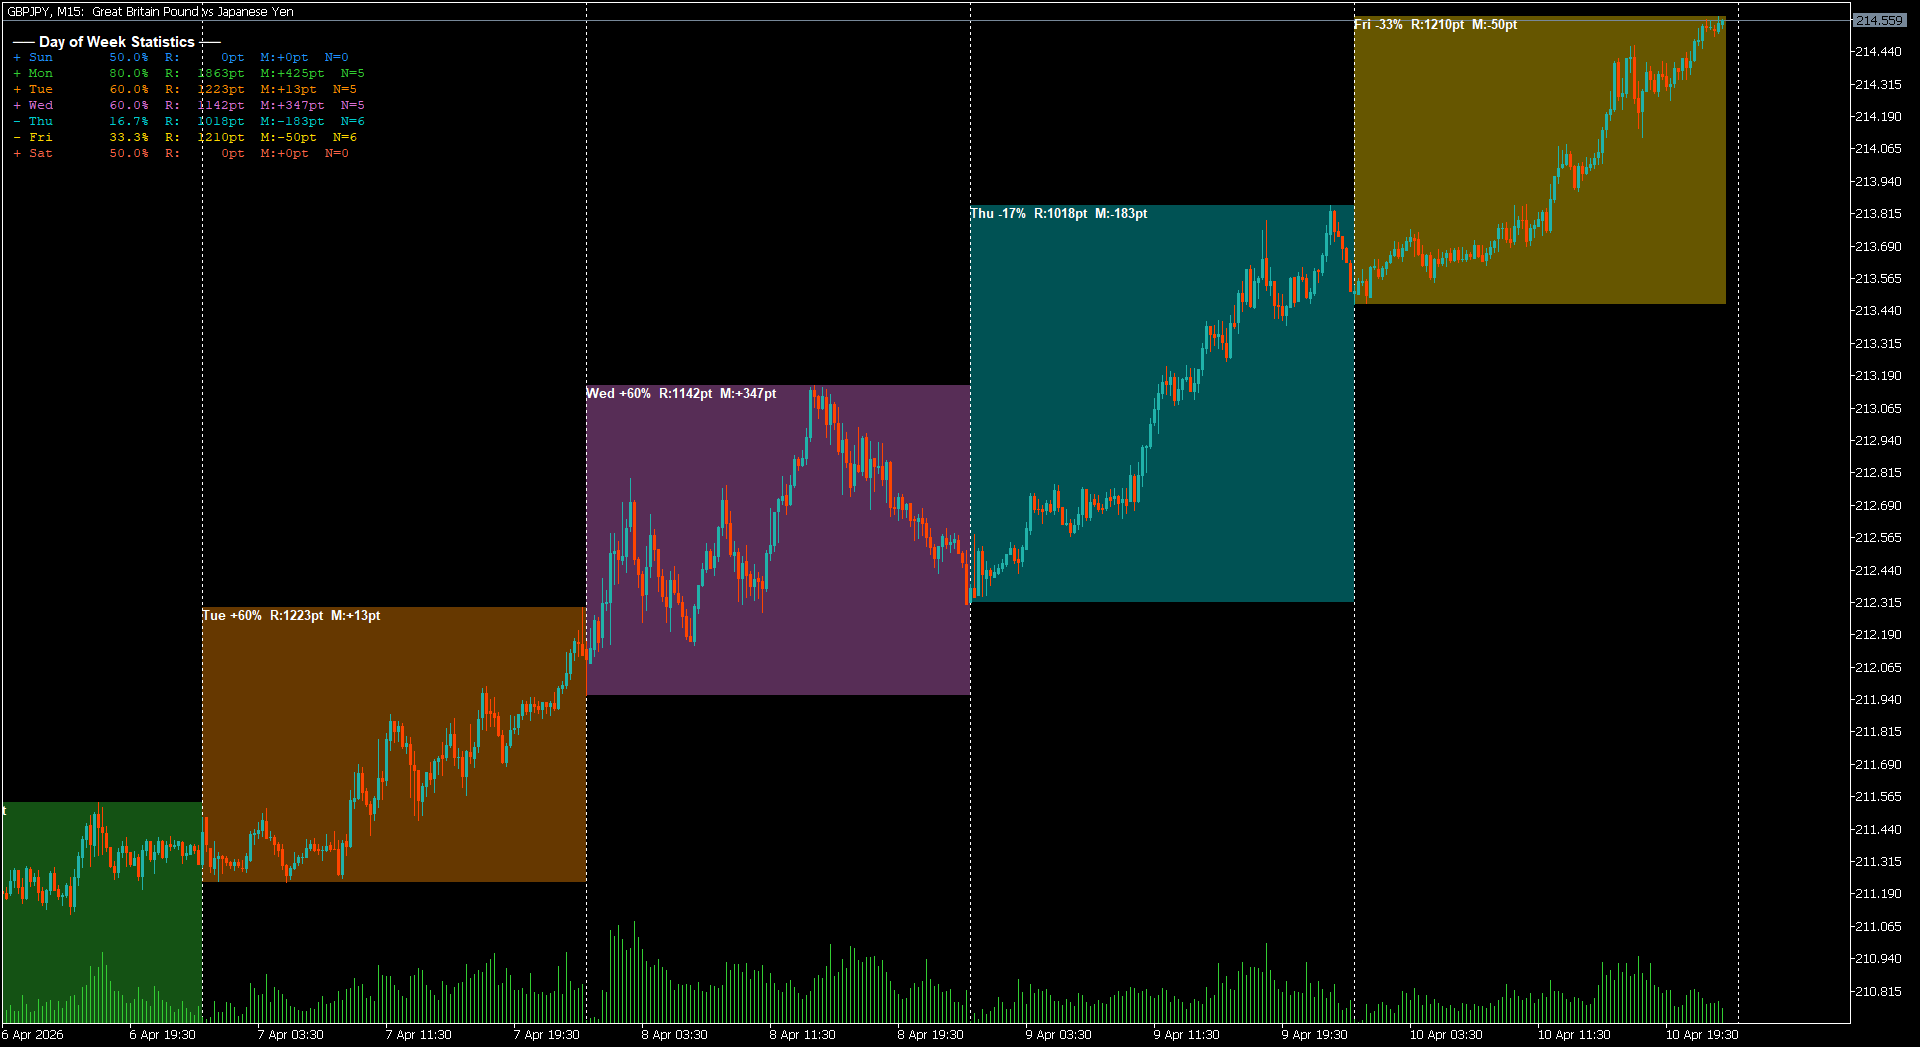
Whichever you like — it genuinely does not matter. The indicator pulls its own data at the timeframe each mode needs, so ten Mondays is ten Mondays whether you are looking at an M5 or a weekly chart.
Which symbols and brokers does it work with?
Anything your MT5 broker quotes: forex, metals, indices, crypto, stocks. Broker suffixes are handled automatically — type EURUSD and it will find EURUSD.pro or whatever your broker calls it.
How much history do I need?
More than you think, and the indicator will tell you when you do not have enough — that is exactly what the N and CONF columns are for. Rather than hiding a thin sample behind a confident-looking percentage, it shows you the sample size and scores the number accordingly.
Can I run it alongside my EA?
Yes. It is an indicator, not an Expert Advisor, so it leaves your EA slot free. You can also run several copies on the same chart — one on day of week, another on sessions.
What exactly does the source let me do?
Read it, modify it, and use your modified version on your own accounts indefinitely. You can lift the statistics into your own EA for personal use. What you cannot do is redistribute or resell it, in original or modified form.
I am upgrading from v1. What changed?
v2.10 is close to a rewrite. The multi-symbol scanner, heatmap, confidence scoring, proof panel, intraday clock, excursion statistics, presets and CSV export are all new.
Stop trading percentages you can't verify.
Every number on screen comes with its sample size and a confidence score — so you always know whether an edge is real or twenty lucky coin flips.
You must be logged in to post a review.

Reviews
Clear filtersThere are no reviews yet.