


If you’re delving into the world of forex trading, exploring strategies that combine technical indicators with market dynamics could potentially yield profitable results. In this guide, we present an effective Bollinger Band Based Strategy tailored for AUDCAD, focusing on the 1-hour timeframe and leveraging the power of Bollinger Bands.
Strategy Overview:
- Currency Pair: AUDCAD
- Timeframe: 1 Hour
- Indicators: Bollinger Bands
- Strategy Type: Mean Reversion
What are Bollinger Bands? (BB): Bollinger bands are a popular technical analysis tool that consists of a middle band (typically a simple moving average) and two outer bands that represent standard deviations from the middle band. This strategy utilizes Bollinger Bands to identify potential buying and selling opportunities based on price volatility.
Key Parameters:
- Points: 0.00001
- BB Period: 55
- Deviation Period: 1.4
- Max Space: 900 pips
Strategy Implementation:
- Calculation of Bollinger Bands: Using the specified parameters, Bollinger Bands are calculated for the AUDCAD pair.
- Space Analysis: Various metrics such as upper space, lower space, total space, and expansion rate are computed to gauge price volatility.
- Signal Generation:
- Neutral Condition: If the total space exceeds a predefined threshold, indicating high volatility, a neutral stance is adopted.
- Sell Condition: When the high price breaches the upper Bollinger Band, a sell signal is triggered.
- Buy Condition: Conversely, if the low price penetrates the lower Bollinger Band, a buy signal is generated.
- Position Management: Positions are adjusted based on the proximity of the closing price to the Bollinger Bands, ensuring timely entry and exit from trades.
Optimization Performance:
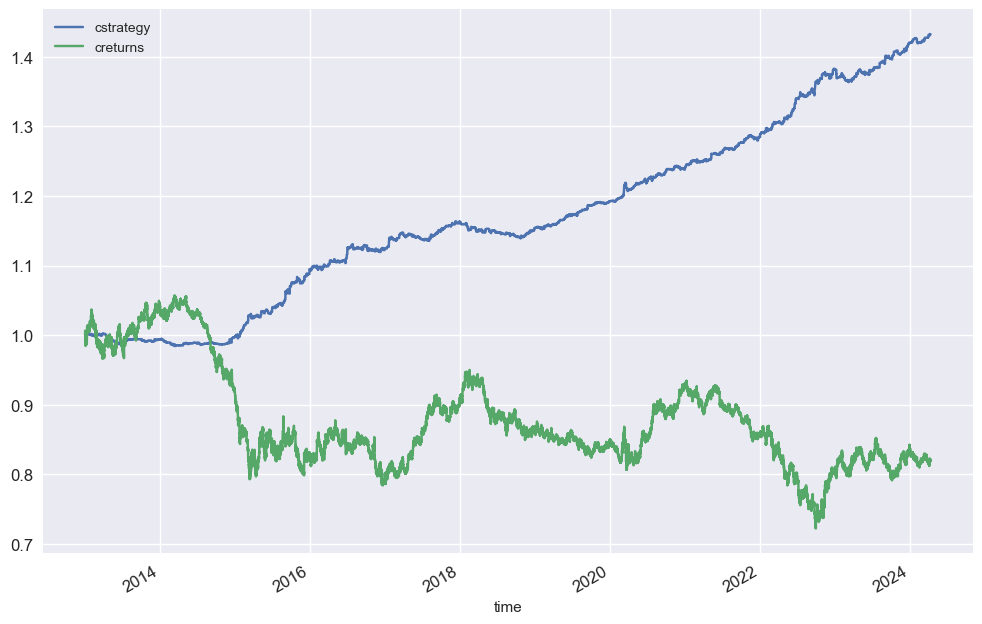
- Cumulative Returns: Throughout the backtesting period from 2013 to 2024, the strategy exhibited a cumulative return of 0.8503, while the cumulative return of the benchmark strategy stood notably higher at 1.9315.
- Out/Under Performance: The strategy demonstrated an outperformance of 1.0811 compared to the benchmark, indicating its ability to generate superior returns relative to the market.
Overall Performance:
- Compound Annual Growth Rate (CAGR): The strategy achieved a CAGR of 6.12%, showcasing its consistent growth rate over the analyzed period.
- Annualized Mean: With an annualized mean return of 5.94%, the strategy maintained a steady performance on an annual basis.
- Annualized Standard Deviation: The annualized standard deviation, a measure of volatility, was calculated at 4.88%, indicating the level of risk associated with the strategy.
- Sharpe Ratio: A Sharpe Ratio of 1.2556 highlights the strategy’s risk-adjusted return, with higher values indicating better risk-adjusted performance.
- Sortino Ratio: The Sortino Ratio, which considers only downside volatility, was determined to be 1.7816, reflecting the strategy’s efficiency in generating returns while minimizing downside risk.
- Maximum Drawdown: The strategy experienced a maximum drawdown of 7.06%, representing the largest peak-to-trough decline observed during the backtesting period.
- Calmar Ratio: With a Calmar Ratio of 0.8668, the strategy’s risk-adjusted return relative to its maximum drawdown is evaluated, indicating how efficiently returns are generated concerning the risk endured.
- Max Drawdown Duration: The strategy’s maximum drawdown duration lasted for 245 units of time, emphasizing the importance of assessing the duration of drawdown periods.
- Kelly Criterion: The Kelly Criterion, a formula used to determine the optimal size of a series of bets, was calculated at 25.4821, providing insight into the optimal capital allocation for maximizing returns while managing risk effectively.
VIEW THE FINANCIAL ANALYSIS PDF HERE
Conclusion: Through comprehensive backtesting spanning over a decade, the Bollinger Band based strategy for AUDCAD on the 1-hour timeframe has demonstrated robust performance metrics. With a notable cumulative return and consistent annualized returns, coupled with favorable risk-adjusted measures such as the Sharpe and Sortino Ratios, the strategy showcases its potential to generate attractive risk-adjusted returns. Additionally, the strategy’s manageable drawdowns and favorable Calmar Ratio underscore its resilience during adverse market conditions. Overall, the results affirm the effectiveness of the strategy in navigating the dynamics of the AUDCAD forex market, providing traders with a reliable framework for achieving their investment objectives.

 MT4 Expert Advisors
 MT5 Expert Advisors
 MT4 Indicators
 MT5 Indicators