


Introduction:
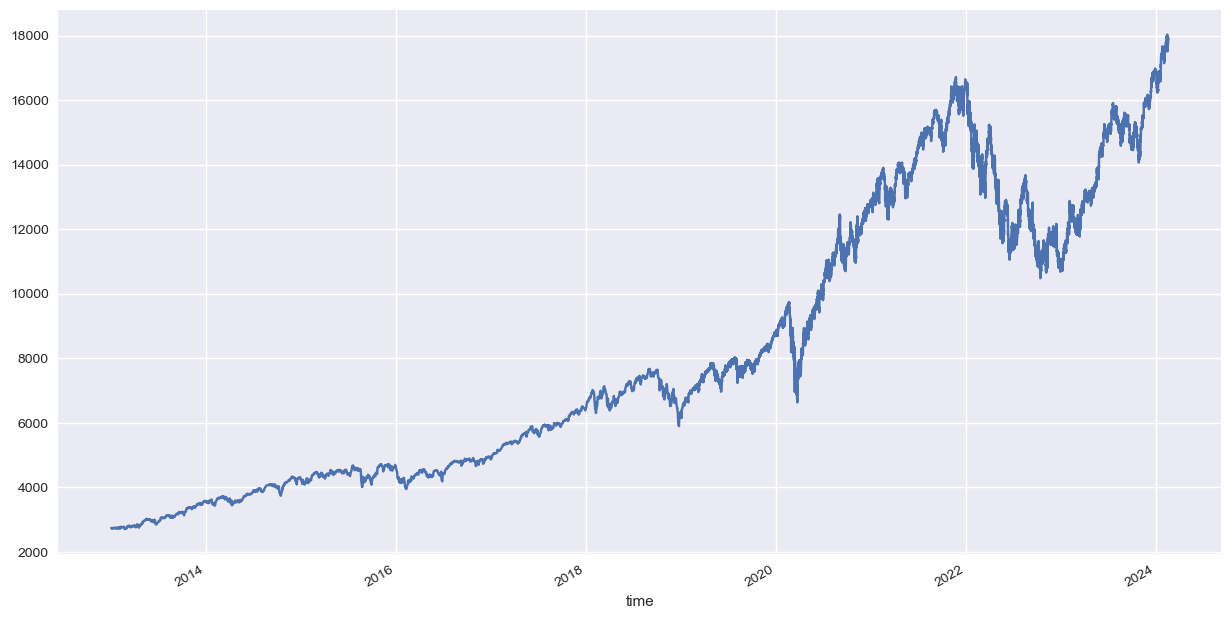
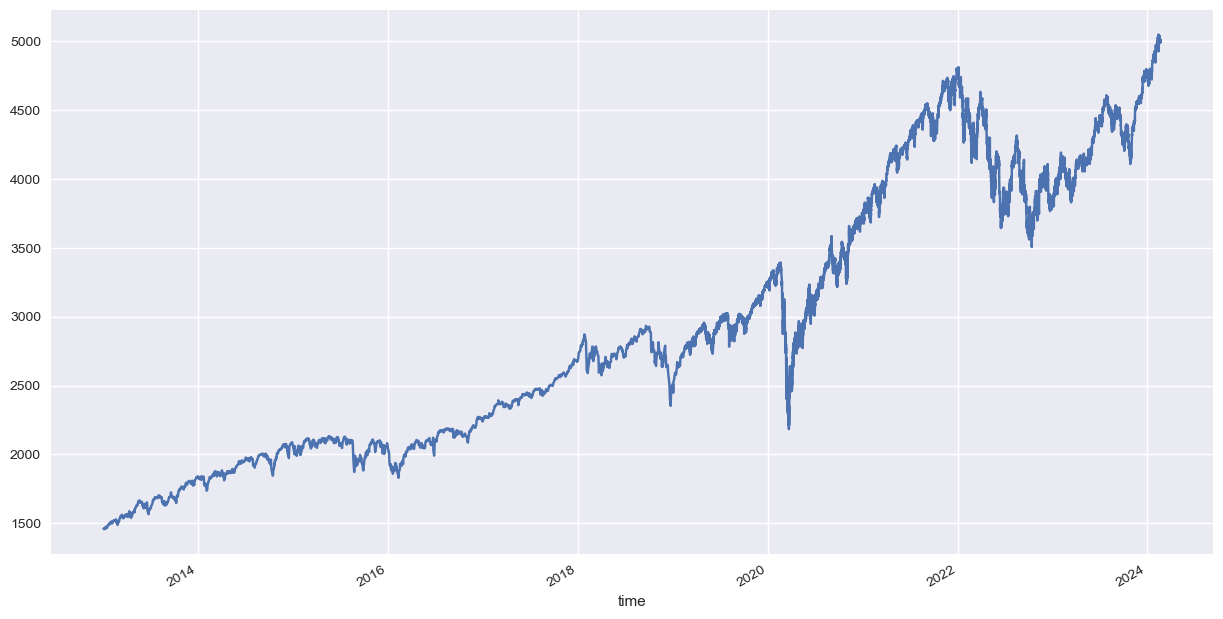
Welcome to The The Moving Average Strategy! In the realm of financial markets, moving averages stand as a fundamental tool for technical analysis, aiding traders in interpreting trends and making informed decisions. In this article, we delve into the application of moving averages in devising a trading strategy for two prominent indices, NAS100 and SPX500. The strategy’s implementation and optimization are based on Python code executed in Jupyter Notebook, providing a practical approach to leveraging moving averages for enhanced trading outcomes. you can clearly see the default plot of the close prices of the NAS100 and SPX500, below on the 1Hr Timeframe
What Are Moving Averages?
Moving averages are widely used in financial analysis to smooth out price data and identify trends over a specified period. They serve as dynamic indicators, reflecting the average price of a security over a set time frame. By calculating the average price over different intervals, moving averages help traders spot potential entry and exit points, as well as the overall trend direction.\
Financial Analysis Objective:
The primary goal of our financial analysis is to develop a robust trading strategy for NAS100 and SPX500, utilizing moving averages on a 1-hour timeframe. We aim to identify optimal entry and exit points based on the crossover of two moving averages, thereby enhancing the probability of profitable trades and outperforming a simple buy and hold strategy.
Strategy Overview: The Moving Average Strategy
- Indices: NAS100, SPX500
- Timeframe: 1 Hour
- Indicators: Moving Averages
- Strategy Type: Trend Following
Key Parameters:
- Fast MA Period: 140 (NAS100), 140 (SPX500)
- Slow MA Period: 100 (NAS100), 50 (SPX500)
- Distance Thresholds: NAS100 – 15000, SPX500 – 10000
- Entry/Exit Points: 0.01
Strategy Implementation:
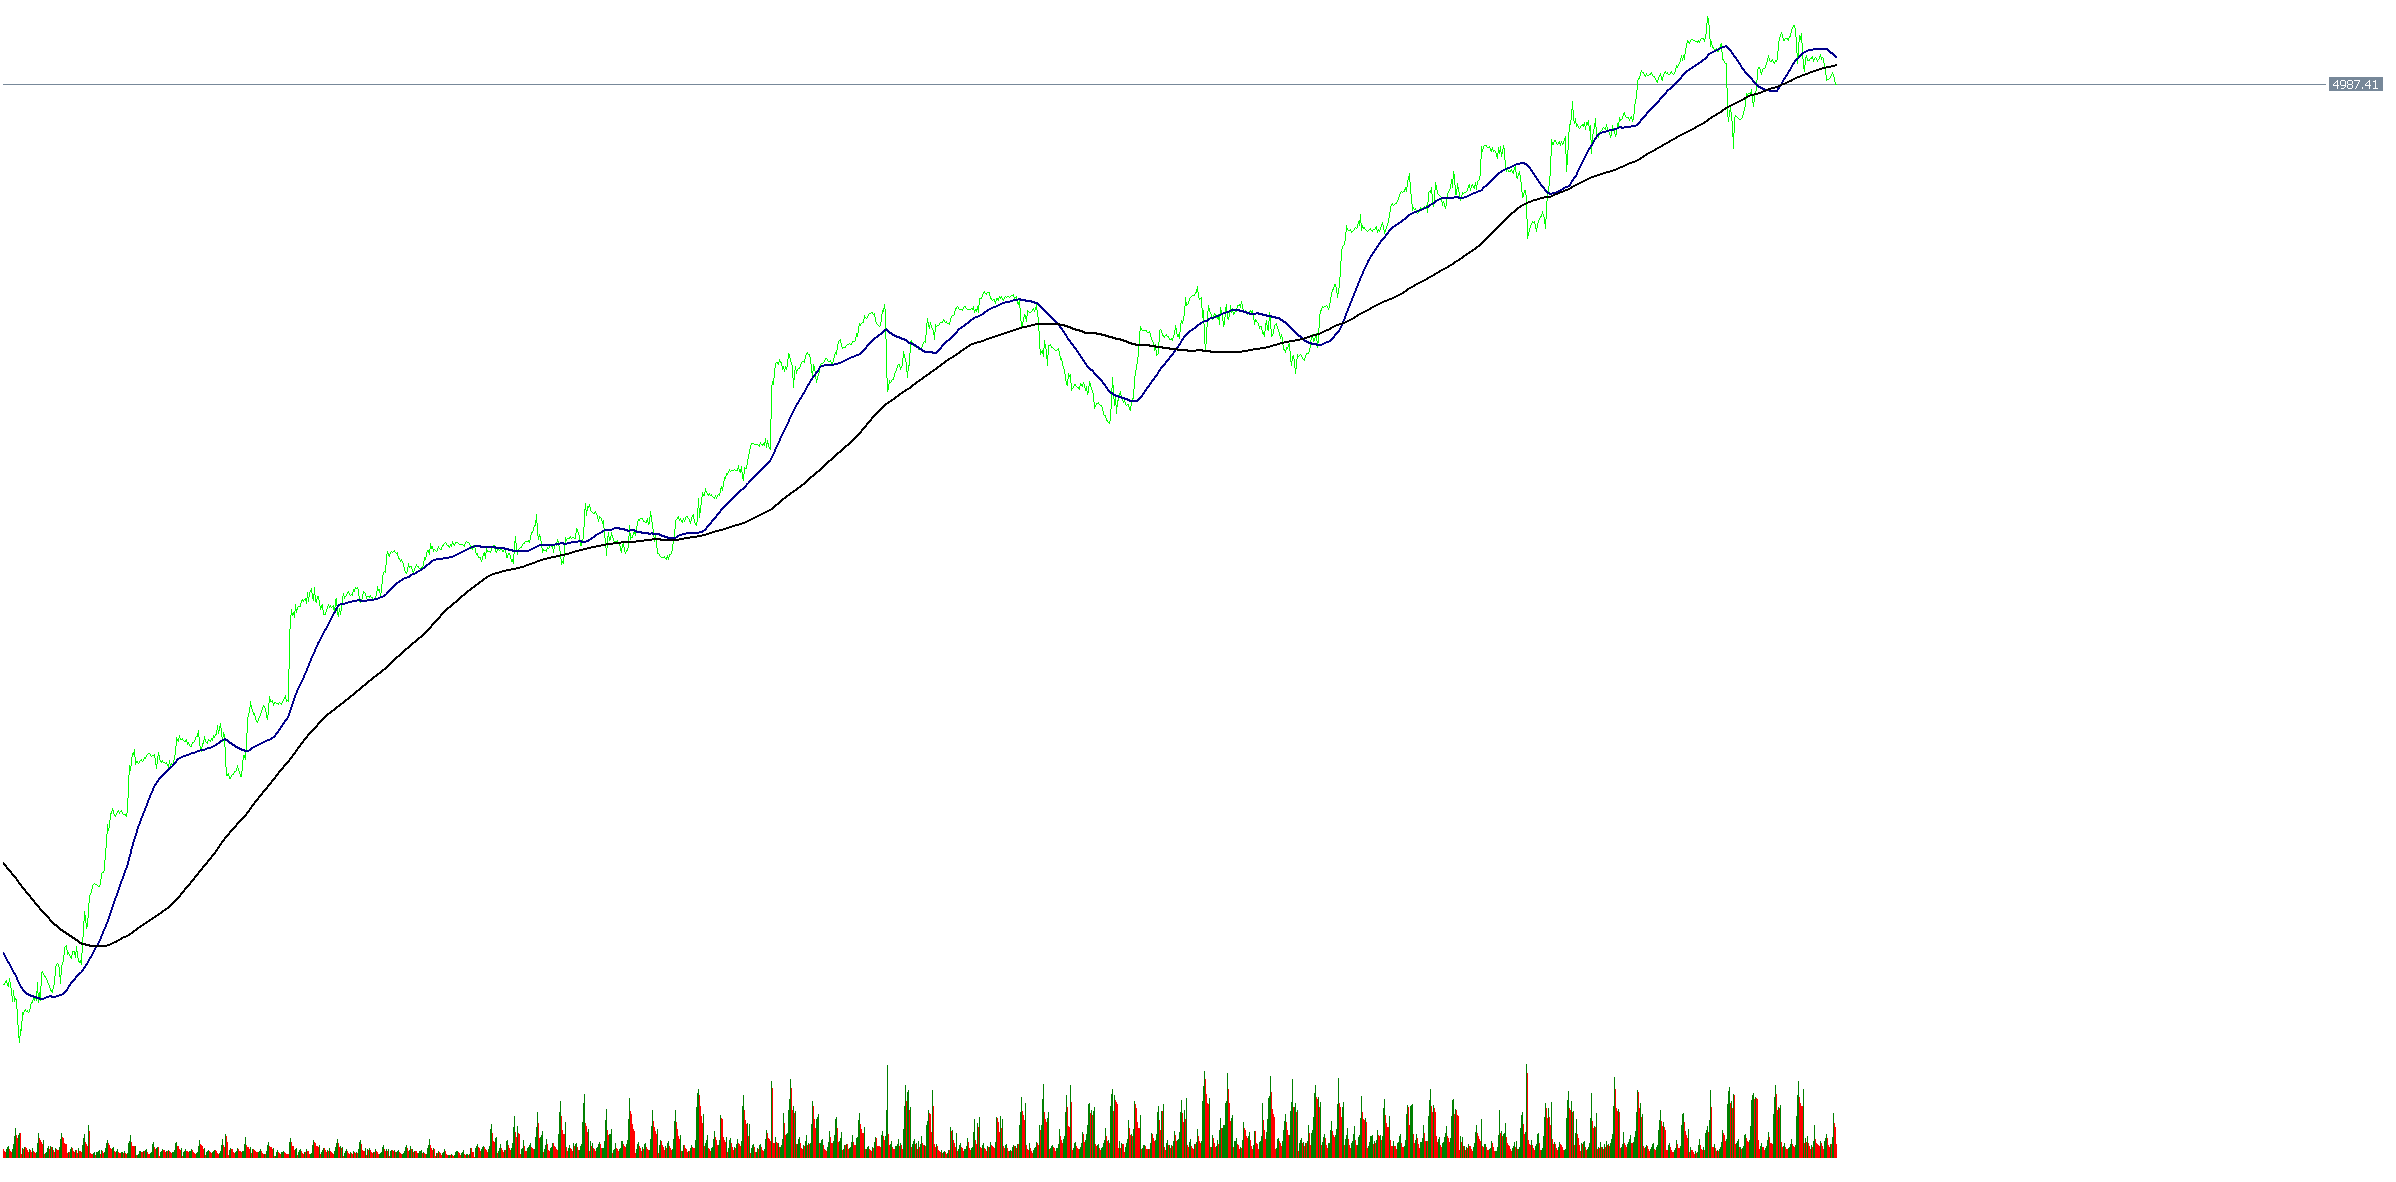
The strategy involves the calculation of two moving averages: a fast MA and a slow MA. When the fast MA crosses above the slow MA, a buy signal is generated, indicating a potential uptrend. Conversely, when the fast MA crosses below the slow MA, a sell signal is triggered, signaling a possible downtrend. The strategy aims to capture trends and capitalize on price movements in the NAS100 and SPX500 indices.
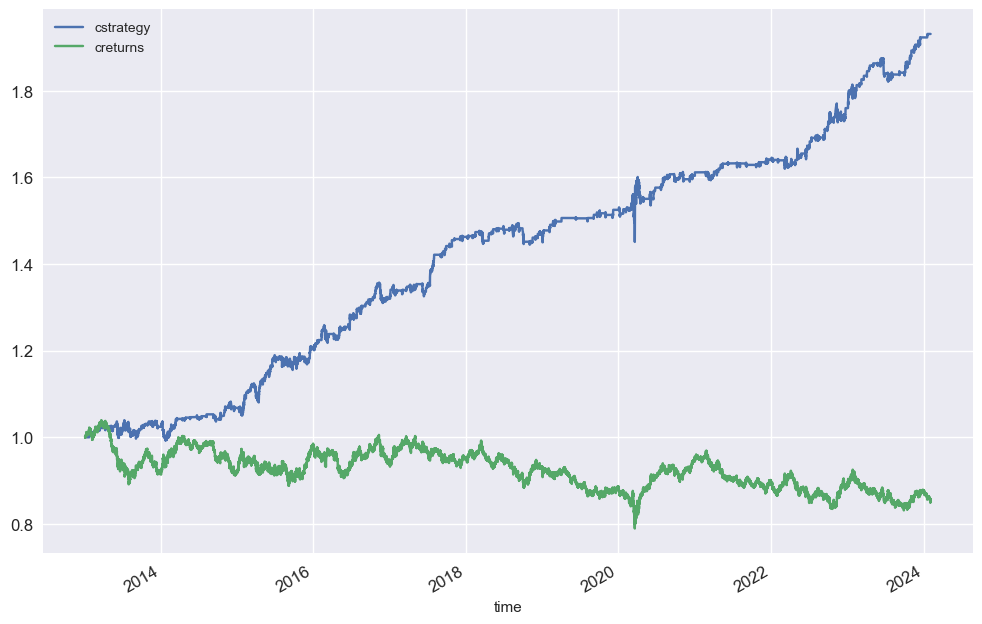
Optimization Performance:
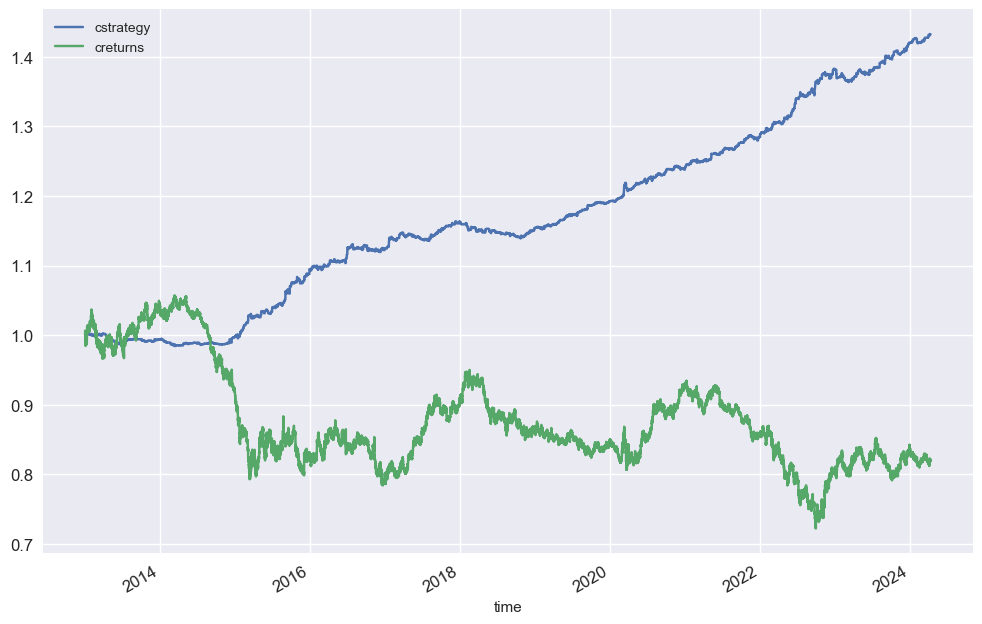
During the backtesting period from 2013 to 2024, the strategy demonstrated significant outperformance compared to a buy and hold approach. With cumulative returns of 9.06 for NAS100 and 3.57 for SPX500, the strategy showcased its effectiveness in generating consistent returns. The Sharpe Ratio, Sortino Ratio, and Calmar Ratio further validate the strategy’s ability to deliver favorable risk-adjusted returns, making it a valuable tool for traders.
Python Code: (PDF)
The Python code used to implement the strategy in Jupyter Notebook is available for download in PDF format. It includes the necessary libraries, data loading, moving average calculation, signal generation, and position management logic.
Conclusion:
In conclusion, the moving average strategy presented here offers a systematic and effective approach to trading NAS100 and SPX500. By leveraging moving averages, traders can identify trends and capitalize on market movements, leading to enhanced trading outcomes. The strategy’s performance metrics highlight its potential as a valuable tool for traders seeking to optimize their trading strategies in dynamic market conditions.

 MT4 Expert Advisors
 MT5 Expert Advisors
 MT4 Indicators
 MT5 Indicators