
In the dynamic world of trading, strategies that capitalize on timing can make a significant difference. One such strategy is the Time Based Reversal Strategy. This approach relies on identifying specific times of the day when the market is more likely to reverse its direction, offering traders an opportunity to profit from these predictable patterns.
In this report, we’ll delve into the statistics of the Time Based Reversal Strategy, exploring how it works, and how traders can implement it in their trading routines. Whether you’re a novice trader looking to expand your strategy toolkit or an experienced trader seeking new insights, this guide will provide valuable insights into leveraging time-based trends for trading success.
This report also includes python files created for the Shreya Framework, all you need to do is copy the files into your strategies folder, select the strategy and start trading!
Note : This article should not be regarded as financial advise of any kind, and we are not to be held liable for any losses incurred from reading this report, or using the files included on this website.
Strategy Overview
- Currency Pairs : AUDNZD, NZDCAD
- Timeframe: 1H
- Time zone : UTC
Indicators or Key Parameters
- Point Value : 0.00001
- Trading cost implemented : -15, covers for spread and commissions
- Parameters used: Trading Hours, Bollinger Bands period and deviation.
Strategy Explanation
Data Preparation:
To prepare the data for the Time Based Reversal Strategy, we followed these steps:
- Loading the Data: We first loaded the historical price data using the
pd.read_csvfunction. Theindex_colparameter was set to “time” to use the “time” column as the index, and theparse_datesparameter was used to parse the “time” column as dates. - Handling Time zones: Since the data was in UTC timezone, we converted it to a different time zone using the
pytz.timezonefunction. The data index was then localized to UTC time zone and converted to the desired time zone using thetz_localizeandtz_convertmethods, respectively. - Calculating Returns: We calculated the logarithmic returns of the closing prices using the
np.logfunction applied to the ratio of the current closing price (data.close) divided by the previous closing price (data.close.shift(1)). These returns are a key metric in many trading strategies. - Determining Direction: To determine the direction of the price movement, we used the
np.signfunction on the “returns” column. This assigns a value of -1 for negative returns (price decrease), 0 for no change, and 1 for positive returns (price increase). - Adding Hour Column: We extracted the hour component from the index to create an “hour” column. This allows us to analyze how the strategy performs at different times of the day.
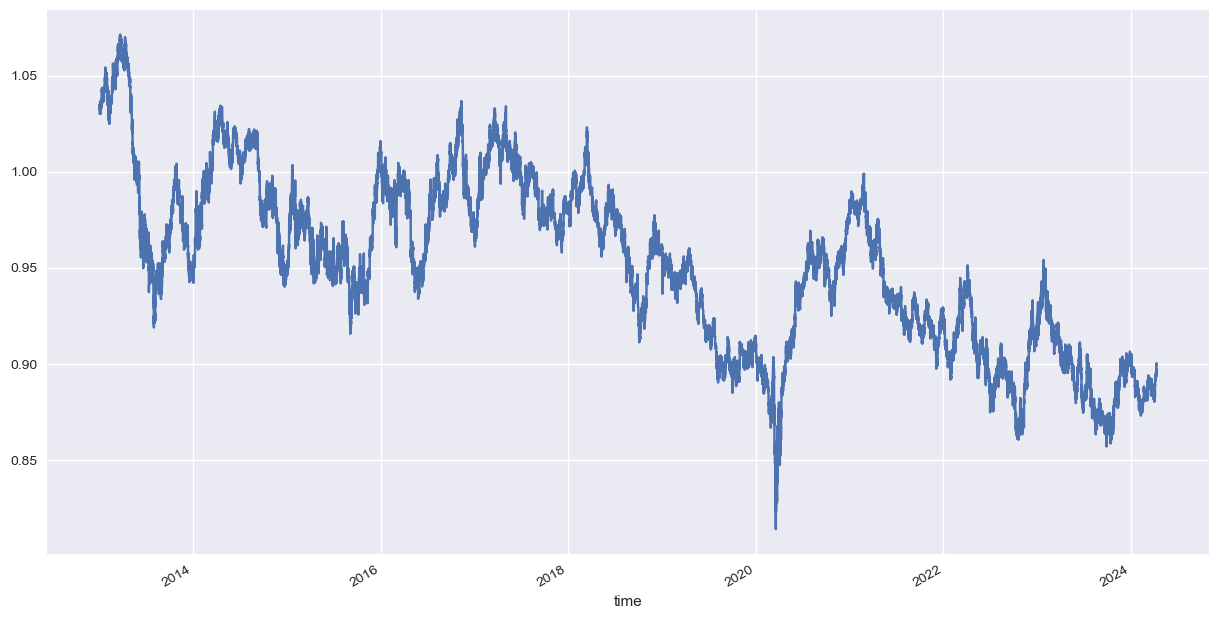
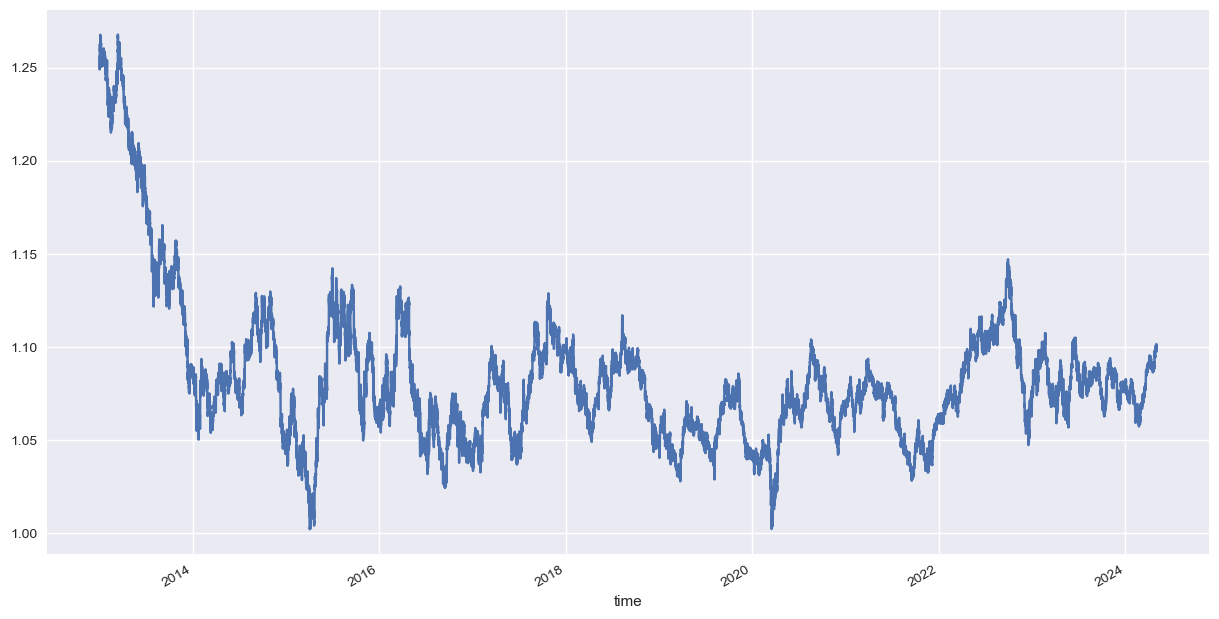
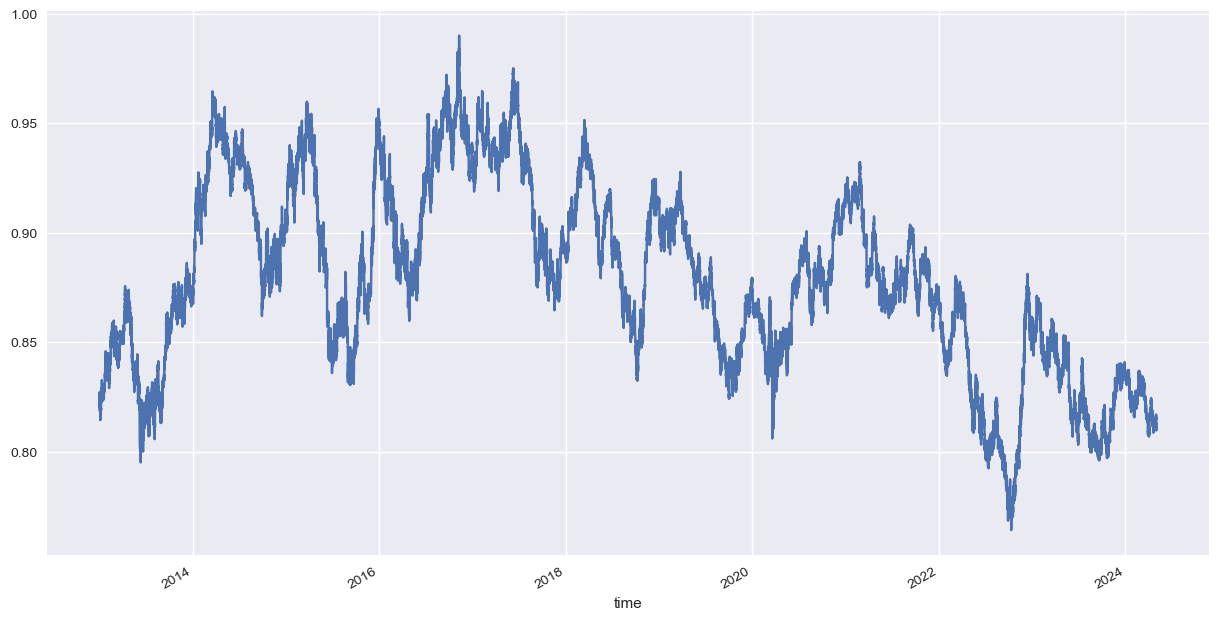
- Visualizing the Data: Finally, we plotted the closing prices using
data["close"].plotto visually inspect the price movements and identify any patterns that may be useful for our strategy.
Visualization of The Close Prices for AUDNZD and NZDCAD
Trading Conditions
Trading Conditions:
The Time Based Reversal Strategy relies on specific conditions to determine when to enter, exit, or hold a position. These conditions are based on various technical indicators and price action metrics. Here’s how we define the trading conditions:
- Neutral Condition (
conda): This condition is met when the current hour is greater than or equal to the specified open hour (open_hour). It indicates that the market is open for trading. - Buy Condition (
cond1,cond2,cond3):cond1: The closing price is below the lower Bollinger Band (bb_lower), suggesting a potential oversold condition.cond2: The lower wick of the candlestick is shorter than the upper wick, indicating potential buying pressure.cond3: The ratio of the length of the body of the candlestick to the total length of the wick is greater than 0.25, indicating a strong price movement.
- Sell Condition (
cond11,cond12,cond13):cond11: The closing price is above the upper Bollinger Band (bb_upper), suggesting a potential overbought condition.cond12: The upper wick of the candlestick is shorter than the lower wick, indicating potential selling pressure.cond13: The ratio of the length of the body of the candlestick to the total length of the wick is greater than 0.25, indicating a strong price movement.
- Exit Condition (
cond0): This condition is met when the current hour is equal to the specified close hour (close_hour). It indicates that trading should be closed for the day.
Based on these conditions, we calculate the position variable, which determines whether to enter a long position (1), a short position (-1), or hold no position (0). The position is forward-filled to ensure that the position remains constant until a new trading signal is generated.
Analysis Performance
For The Time reversal based strategy, the entire financial analysis was done from 2013 up to 2024. Optimization was done randomly taking between 2-5 years into consideration. Forward test was carried out mostly based on 2024, 2016-2018, 2020-2023. below is a comparison between the default strategy vs the default buy and hold.
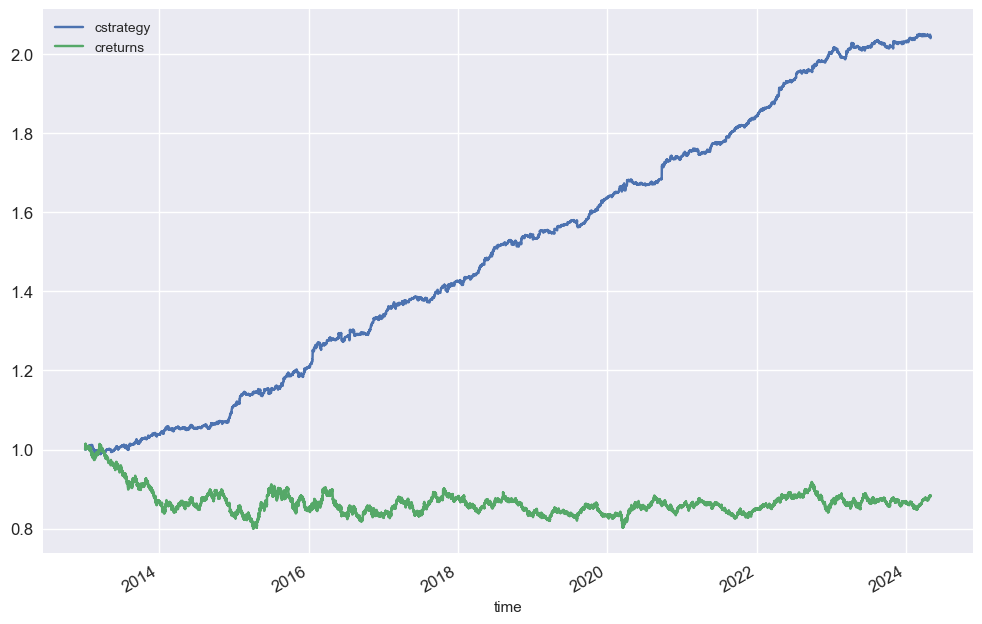
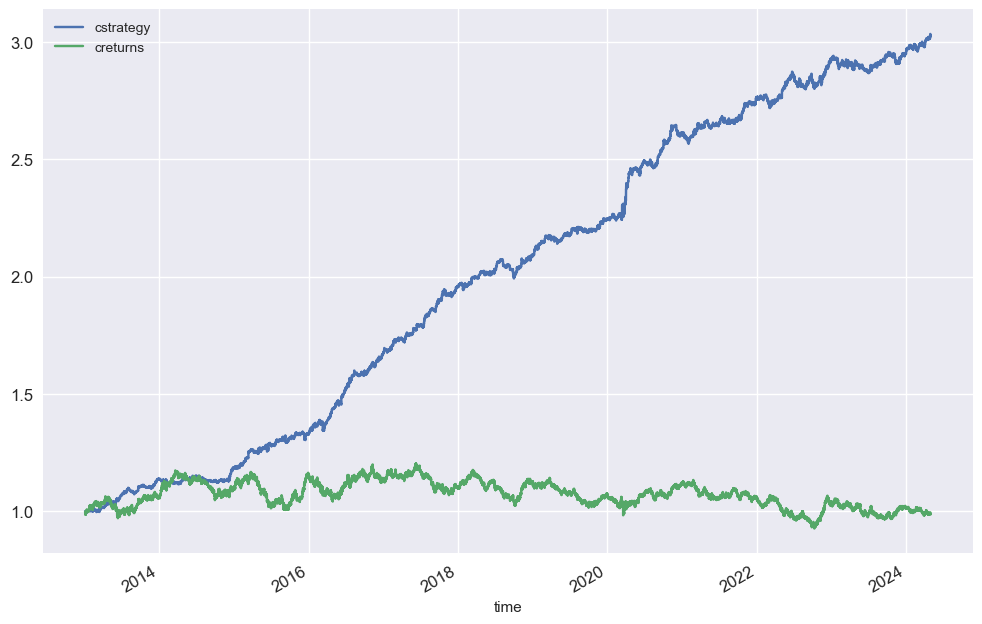
Results of the financial analysis have proven to be profitable over time, the detailed report of parameters such as Strategy returns, Annualized mean, Annualized risk, Maximum draw down, Sharpe ratio, Sortino ratio CAGR, Kelly criterion, will be included in the strategy report file
View The Financial Analysis PDF Here
Download the Strategy for Shreya Framework
Join the Trading Kernel Community and Academy
Join the vibrant Trading Kernel community at Trading Kernel Stack, where traders from around the world gather to discuss trading strategies, share insights, and collaborate on optimizing their trading performance. Whether you’re a seasoned trader or just starting, our community offers a supportive environment to learn and grow together.
Learn from the Best at Trading Kernel Academy
Expand your trading knowledge and skills at Trading Kernel Academy. Our academy offers a comprehensive range of courses on trading, back testing, optimizing, and much more. Whether you’re interested in mastering technical analysis or learning advanced trading strategies, our academy has you covered.
Why Join Trading Kernel?
- Community Engagement: Connect with like-minded traders, share your experiences, and learn from others in our vibrant community.
- Expert Guidance: Access courses taught by industry experts, providing you with valuable insights and practical knowledge.
- Continuous Learning: Stay updated with the latest trends and developments in the trading world through our regularly updated content and resources.
- Networking Opportunities: Build relationships with fellow traders and industry professionals, opening doors to new opportunities and collaborations.
Take Your Trading to the Next Level
Whether you’re looking to enhance your trading skills, discuss strategies with peers, or simply expand your trading knowledge, Trading Kernel offers the perfect platform for traders of all levels. Join our community and academy today to embark on your journey to trading success.


